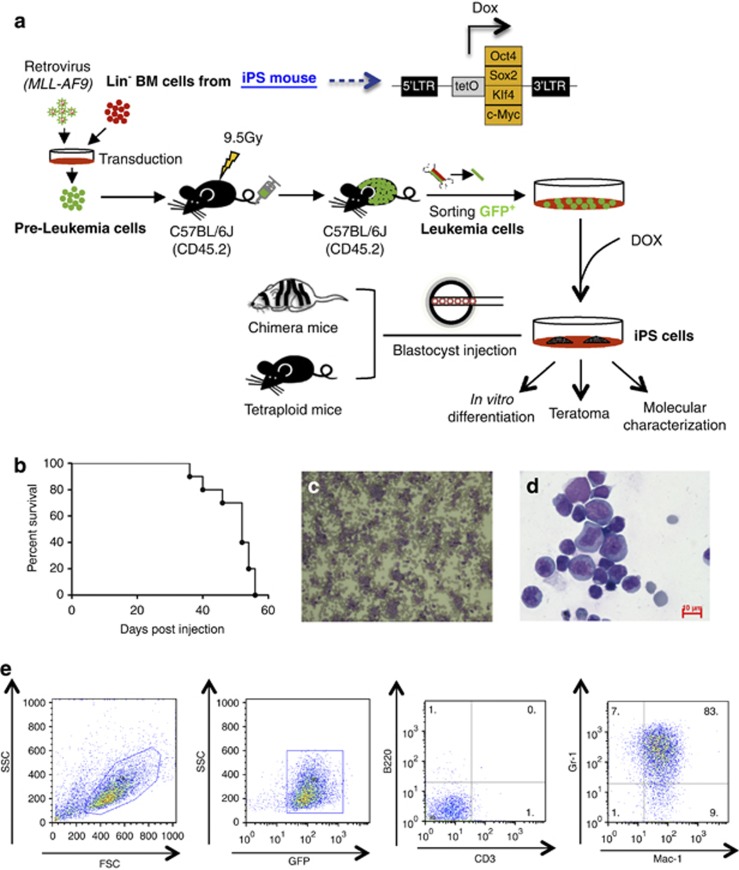
Figure 1.
Experimental design and establishment of AML. (a) Schematic representation of the strategy used in this study for reprogramming primary AML cells toward iPS. (b) A Kaplan–Meyer curve showing the survival of leukemic mice. All the mice died within 2 months (n=9). (c and d) Representative peripheral blood smear and cytospin of BM cells (Wright–Giemsa staining) showing the accumulation of immature myeloid blast cells in AML mice. Scale bars, 10 μm. (e) FACS analysis of bone marrow cells indicating the GFP+Mac-1+Gr-1+CD3−B220− phenotype of the leukemia cells.

