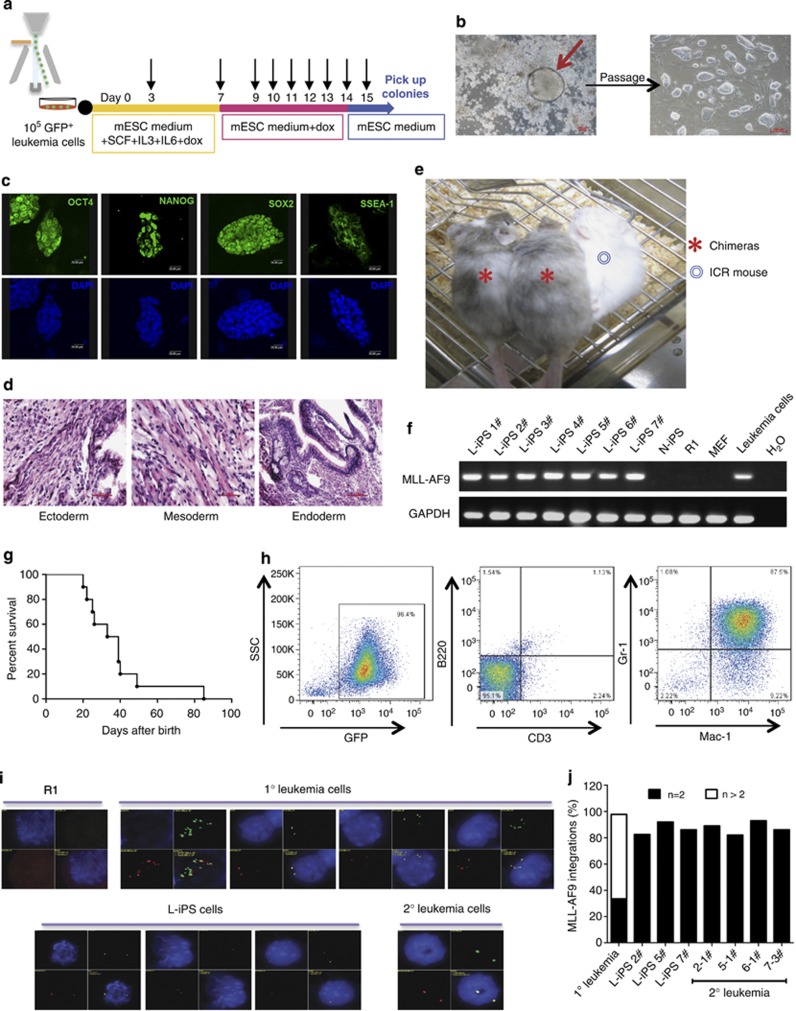
Figure 2.
Characterization of leukemia-derived iPS cells. (a) The reprogramming procedure of AML cells. Black arrow: medium change. (b) Representative L-iPS colony derived from AML cells cultured with Dox and typical morphology of L-iPS cells after propagation. Scale bars, 100 μm. (c) Immunofluorescence staining showing the expression of pluripotency markers (OCT4, NANOG, SOX2 and SSEA-1) in L-iPS cells. The data represent one of three independent experiments. Scale bars, 20 μm. (d) Representative teratoma from L-iPS cells containing all three germ layers (ectoderm, mesoderm and endoderm). H&E staining. The data represent one of four independent experiments. Scale bars, 50 μm. (e) Blastocyst injection of L-iPS cells generated chimeric mice with high chimerism. The data represent two of ten chimeras. (f) Genomic DNA PCR showing the integration of MLL-AF9 fusion gene in L-iPS cells, demonstrating that all iPS cells tested were derived from the primary AML cells. (g) A Kaplan–Meyer curve showing the survival of chimeric mice. Most chimeras died within 2 months (n=10).(h) FACS analysis of bone marrow cells isolated from diseased chimeras showing the GFP+Mac-1+Gr-1+CD3−B220− phenotype (identical to that in primary leukemia). (i) quantitative fluorescence in situ hybridization analysis showing the MLL-AF9 integrations in R1 cells (negative control), 1° leukemia cells, L-iPS cells and 2° leukemia cells. DAPI, blue; MLL 5′, green; MLL 3′, red. (j) Percent MLL-AF9 integration in 1° leukemia cells, L-iPS cells (2#, 5# and 7#) and 2° leukemia cells (2-1#, 5-1#, 6-1# and 7-3#). 300 cells/ sample were counted.

