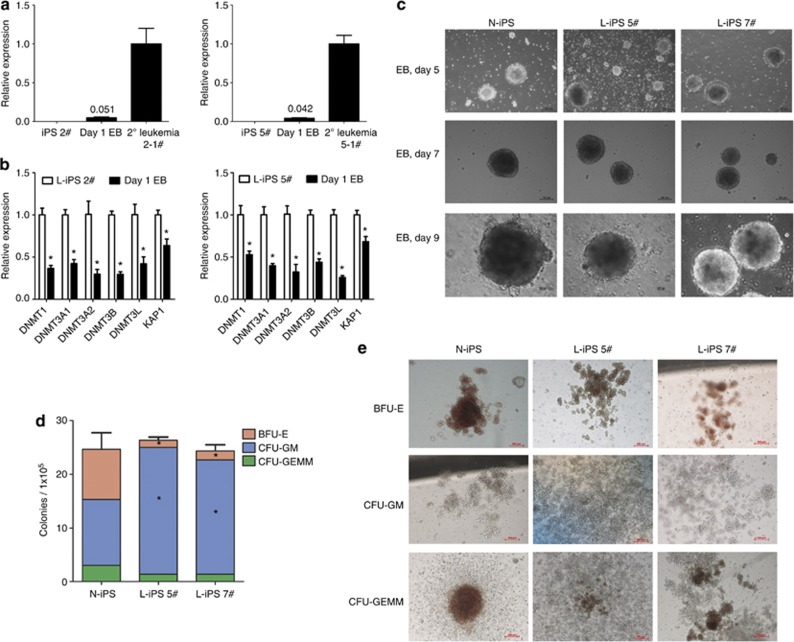
Figure 4.
Hematopoietic colony formation of L-iPS cells and N-iPS cells. (a) qRT-PCR analysis of MLL-AF9 gene expression in L-iPS (2#, 5#) and EB cells on day 1 and in 2° leukemia cells (n=3). Bars represent mean±s.d. of EBs. (b) qRT-PCR analysis of Dnmts and KAP1 genes expression in L-iPS (2#, 5#) and EB cells at day 1 (n=3). Bars represent mean±s.d. *P<0.05. (c) Representative photomicrographs of EBs derived from N-iPS, L-iPS 5# and L-iPS 7# on days 5, 7 and 9. Scale bars, 100 μm. (d) The number of BFU-E, CFU-GM and CFU-GEMM colonies derived from 1 × 10⁵ cells of day 10 EBs of N-iPS, L-iPS 5# and L-iPS 7#. Bars represent mean±s.d. (e) Representative images of BFU-E, CFU-GM and CFU-GEMM colonies derived from day 10 EBs of N-iPS, L-iPS 5# and L-iPS 7#. Scale bars, 100 μm. The data represent one of three independent experiments.

