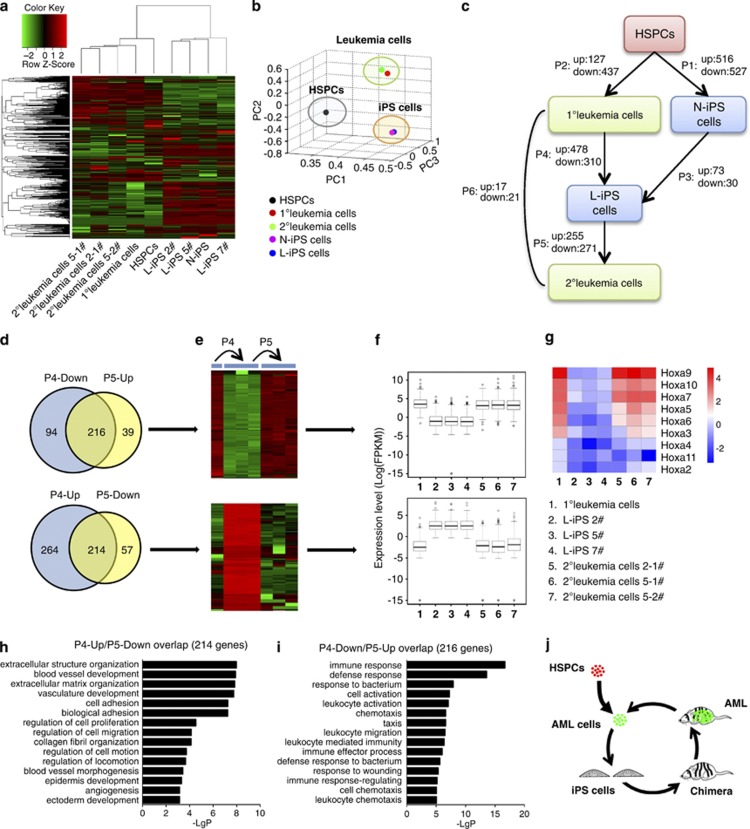
Figure 5.
Molecular profiles indicating the conversion of leukemia and iPS cells. (a) Unsupervised hierarchical clustering showing gene expression profiles in different samples. Color indicates normalized expression level (log); red corresponds to higher expression. Row and column represent gene and sample, respectively. (b) Principal component analysis of gene expression profiles of different samples indicating similarity between cells from different origins. (c) A diagram showing the relationship between each sample and the numbers of differentially expressed genes in each process. Up: genes upregulated in arrow-pointing cells; down: genes downregulated in arrow-pointing cells. P1∼P6: differentially expressed genes in these processes. (d–f) Venn diagram detailing shared and distinct genes between P4 and P5. Heatmap and box plots showing expression profiles of these genes in 1° leukemia cells, L-iPS cells and 2° leukemia cells. X axis: sample; y axis: expression level of each gene, log transformed. (g) Heatmap showing the Hoxa gene-expression level in 1° leukemia cells, L-iPS cells and 2° leukemia cells. Color indicates normalized expression level (log); Red corresponds to higher expression. Row and column represent gene and sample, respectively. (h and i) Gene ontology analysis of biological functions of the two gene sets (P4-up/P5-down and P4-down/P5-up, Supplementary Table S3), showing the P-values of the first 15 categories. (j) Schematic presentation of the reversible process of ‘leukemia-iPS-leukemia'.

