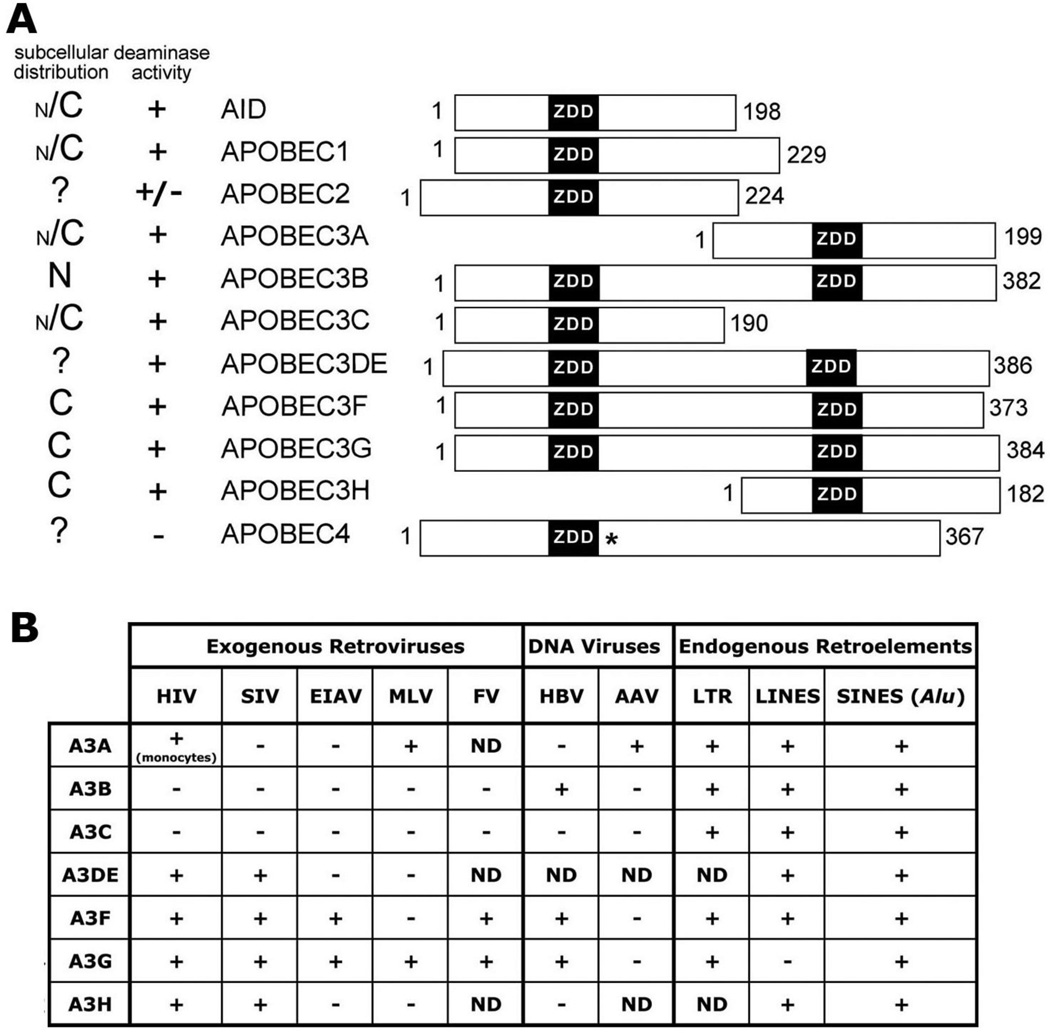
Figure 2. APOBEC family localization and activity.
A. Bar diagrams of human APOBEC proteins and their relative alignments according to exon junctions. The ZDD motifs (black) and number of amino acids for each protein are indicated. The (*) next to the ZDD for APOBEC4 indicates that it is divergent from the consensus ZDD. The relative subcellular distribution is on the left with N for nuclear and C for cytoplasmic, and ‘?’ if localization is unknown. The size of N or C indicates relative distribution. The deaminase activity is indicated by a + or − and the +/− for APOBEC2 indicates mixed results depending on the system (see text). B. A chart of A3 proteins’ activity on different mobile genetic elements, with + for active and − for inactive and ND when activity has been not determined. The (monocytes) under the A3A HIV activity indicates that it has only been shown to be active in monocyte derived cells. The information in A and B was compiled from references within the text.

