
Figure 3.
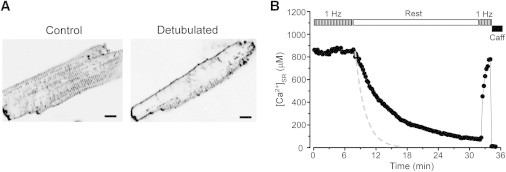
Effect of myocyte detubulation on rest-dependent [Ca2+]SR decline. (A) Images of control and detubulated myocytes stained with Di-8-ANEPPS. Calibration bar corresponds to 10 μm. (B) The decline of [Ca2+]SR during rest in detubulated myocytes. Before rest, myocytes were electrically stimulated at the constant rate of 1 Hz. Application of 10 mM caffeine at the end of the experiment caused complete depletion of the SR. For comparison, the dashed line shows the rate of [Ca2+]SR decline in control myocytes.