
Figure 3.
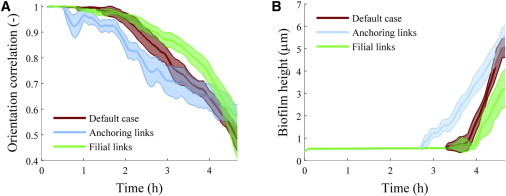
(A) Orientation correlation coefficient. (B) Biofilm thickness, for simulated colonies of rod-shaped cells growing on a planar substratum. The shaded regions represent the 95% confidence interval for the mean, based on 10 simulations (two-tailed t-test). To see this figure in color, go online.