
Figure 1.
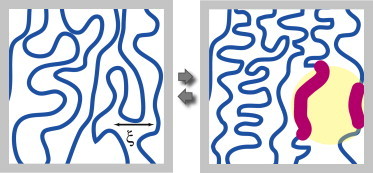
Example of a scalar event. (Left panel) Equilibrium state of chromatin. The length scale ξ indicates the average spacing between adjacent sections of the 10-nm fiber. (Right panel, yellow region) Localized region where 10-nm fiber has been chemically altered, with respect to the equilibrium state, by (de)acetylation and/or (de)methylation of the histones. Sections of the 10-nm fiber that have been chemically altered are shown (red). Neither the nucleosomes nor the enzymes that produce the alterations are shown. The chemical alteration causes a local change in the solubility of the 10-nm fiber, causing influx or efflux of solvent. (Also in right panel) Increased solubility of localized decondensation of the chromatin. (Gray arrows) These changes are reversible. (Gray frame) Field of view. To see this figure in color, go online.