
Figure 2.
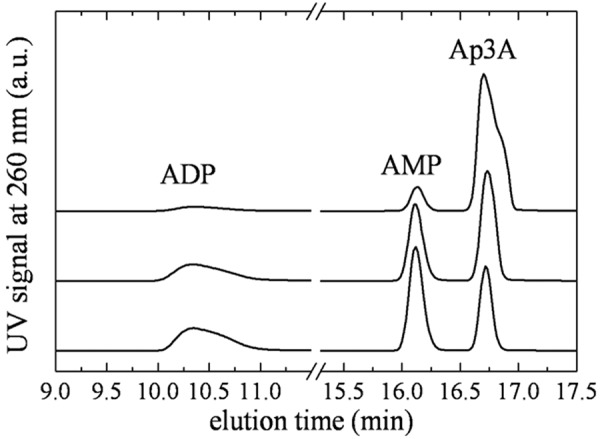
Identification of Ap3A cleavage products by HPLC. Elution profile of NPP4-Ap3A reaction components. (Top to bottom) Reaction samples quenched at 2, 15, and 30 minutes after mixing NPP4 with 800μM Ap3A. The AMP/ADP product ratio determined from the integrated peak areas is ∼ 1.1 always.