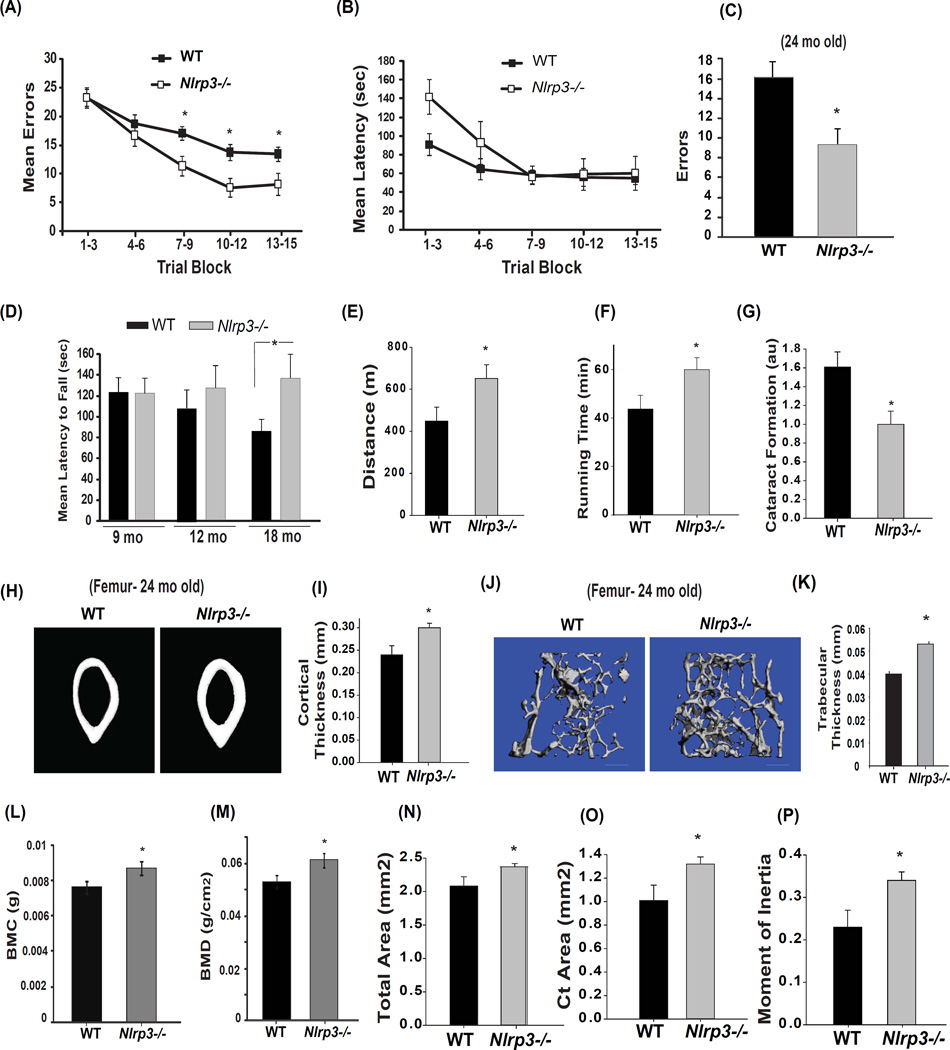
Figure 7. Reduction in Nlrp3 inflammasome activation enhances healthspan and reduces age-related functional decline.
(A) The Stone T-maze test in 18-month old WT mice and age-matched Nlrp3−/− mice (n = 8/group). Mice were given 15 trials in the T-maze with each trial having a maximum length of 300 sec. During each trial, the number of errors committed were recorded (B) Mean latency to reach the goal box during multiple trials of 18-month old WT and Nlrp3−/− mice (n = 8/group). (C) To confirm improved memory and cognitive performance, an additional cohort of WT littermates and Nlrp3−/− mice were aged for 24 months (n=6–8/strain) and total number of errors in a Stone T-maze test were recorded. (D) Compared to WT mice and age-matched Nlrp3−/− mice (18mo old) displayed improved performance on the rotarod (tested in 2 separate cohorts of n = 8 each, 4+4 males and females). (E, F) At 24-month of age additional old WT littermates and Nlrp3−/− mice were also tested for running distance and time using a treadmill test (n = 6–9/group) (p = 0.05). (G) The same cohort of WT littermates and Nlrp3−/− mice were tested for lens opacity in both eyes by an ophthalmologist using a slit lamp and scored on a scale of normal (0), punctuate (1), incipient (2), diffuse (3) and complete (4). The ophthalmologist was blinded to the group identity to reduce investigator bias. (H, I) Representative microcomputed tomographic images of cortical bone cross sections from the mid-femur diaphysis of 24 mol female WT (n = 5) and Nlrp3−/− mice (n = 8). The female WT and Nlrp3−/− mouse femurs were imaged by microcomputed tomography. (J) The microcomputed tomographic scans of trabecular bone mass and (K) trabecular thickness in 24-month old male WT and Nlrp3−/− femorae. (L, M) Bone mineral content of 24-month old male WT and Nlrp3−/− mice (n=13) is measured in grams of calcium hydroxypatite; bone mineral density represents the mineral in bone per area i.e. areal bone mineral density. The coefficient of variation for repetitive scanning ex vivo is approximately 2.4%. Similar to male mice, the 24-month old female Nlrp3−/− mice displayed significant increase in (N) total bone area, (O) cortical area and (P) moment of inertia (MOI). All behavioral and functional analysis in WT and mutant mice were conducted in investigator blinded fashion. All data are presented as Mean (SEM)* P<0.05. See also Figure S6, S7 and S8.

