Figure 1:
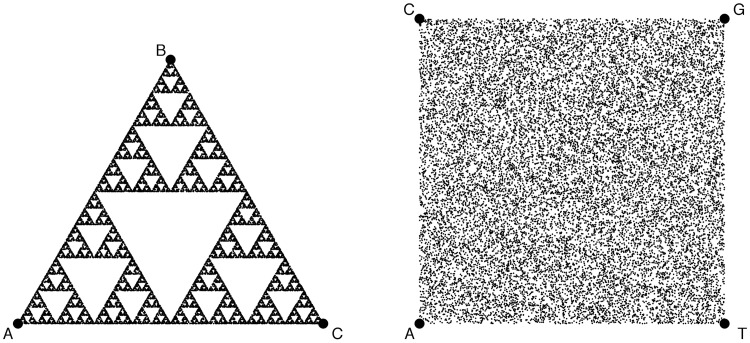
Sierpinski’s triangle (left) and CGR square (right), both generated by running the IM described in Equation 1 with a set of 20 000 random sets of, respectively, three symbols and four symbols - the edges (circles) of the corresponding figures. The square layout (on the right) is the one proposed in [1] to process genomic sequences, with four possible nucleotides, ACGT, one per edge of the CGR square. Any deviation from the uniform random distribution (any structure in the sequence) will produce a structure in the IM projection that is amenable to alignment-free and scale-free analysis. See Figure 1 of [7] for a graphic illustration of the process of generating CGR coordinates, applied to a gene sequence. The code used to generate this figure is available at http://bit.ly/imfig1.

