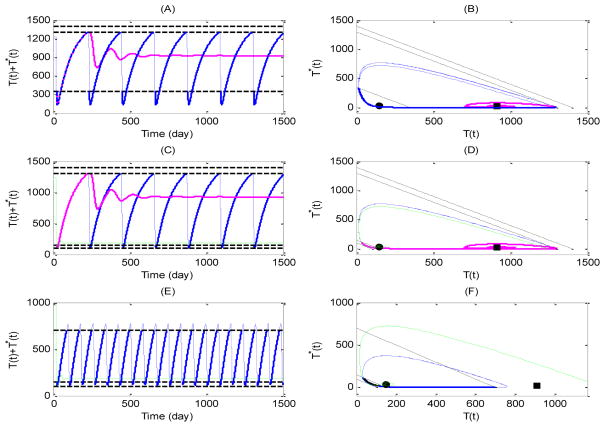
Fig. 2.
Numerical simulations of solutions of drug on-off state systems (3.4) and (3.5) with different low and upper threshold values. Case 2: (A–B) Blue cure for the solution with CTH = 1300ul−1, CTH = 350ul−1, pink curve for the solution with CTH = 1400ul−1, CTH = 350ul−1; Case 3: (C–D) Blue cure for the solution with CTH = 1300ul−1, CTH = 150ul−1, pink curve for the solution with CTH = 1400ul−1, CTH = 350ul−1, and green curve for the solution with CTH = 1300ul−1, CTH = 100ul−1; Case 4: (E–F) Blue cure for the solution with CTH = 700ul−1, CTH = 150ul−1, and green curve for the solution with CTH = 700ul−1, CTH = 100ul−1.

