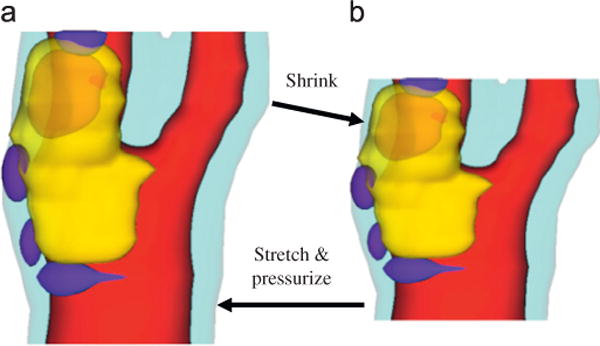
Fig. 1.

Illustration of the shrink–stretch process. The total plaque volume should be conserved. Yellow: lipid; blue: calcification; light blue: outer wall; red: lumen. (a) In vivo shape and (b) numerical start shape. (For interpretation of the references to color in this figure legend, the reader is referred to the web version of this article.)
