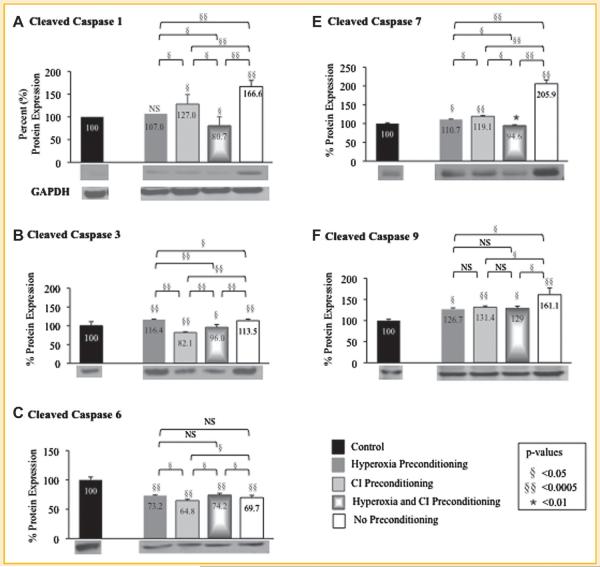
Fig. 4.
Quantitative protein expression and representative Western blots (immediately beneath each graph) of preconditioned mesenchymal stem cells (MSC) following exposure to hypoxia. Western blots were performed to determine protein expression of cleaved caspases (A) 1, (B) 3, (C) 6, (D) 7, and (E) 9 in MSCs that underwent preconditioning with hyperoxia, caspase inhibitor (CI), or the combination prior to hypoxia exposure. Protein expression of MSCs exposed to hypoxia is represented as a percent relative to MSCs exposed only to normoxia without treatment (control) set at 100%. MSCs that underwent preconditioning resulted in a decrease in cleaved caspases compared to MSCs with no preconditioning that were exposed to hypoxia. GAPDH Western blot is also shown as the loading control for all experiments (quantification of protein expression confirmed by computer analysis). P-values above columns represent comparison to control MSCs; NS, non-significant.

