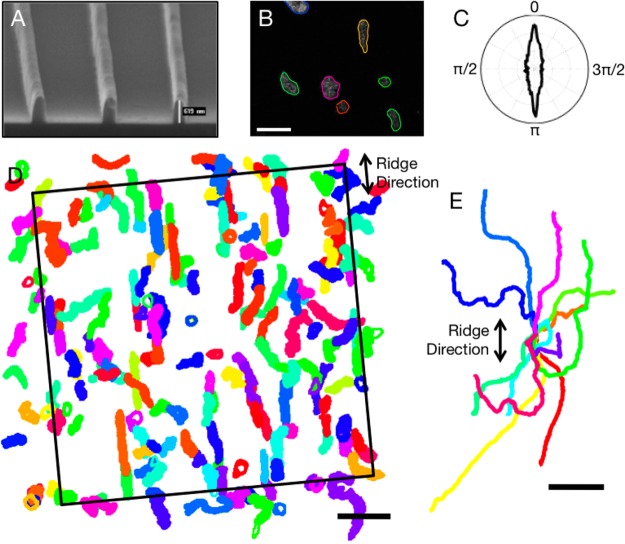
Figure 1.
Contact guidance of amoeboid cells on a grating of parallel nanoridges spaced 1.0 μm apart. (A) Gratings of parallel nanoridges. Shown is an SEM image of several nanoridges. Each nanoridge has a height of a few hundred nm and a width of ∼250 nm. (B) Cytoplasmically dyed Dictyostelium discoideum amoebae migrating on a nanoridge grating. The extracted shape of each cell is overlaid (see Movie S1). The scale bar is 20 μm. (C) Polar plot of velocity direction weighted by speed. From this plot it is apparent that cells migrate preferentially parallel to the nanoridges. 0 and π indicate motion parallel to nanoridges, while π/2 and 3π/2 indicate perpendicular motion. (D) Overlapped, extracted cell shapes over 22 min (355 frames). The scale bar is 50 μm. (Movies S2–S4 show the overlapped shapes of cells on ridges spaced 1.0, 1.5, and 3.0 μm apart.) (E) Centroid motion of 12 cells over 10 min. All tracks were constrained to begin at the graph’s origin. The scale bar is 20 μm.

