
Figure 5.
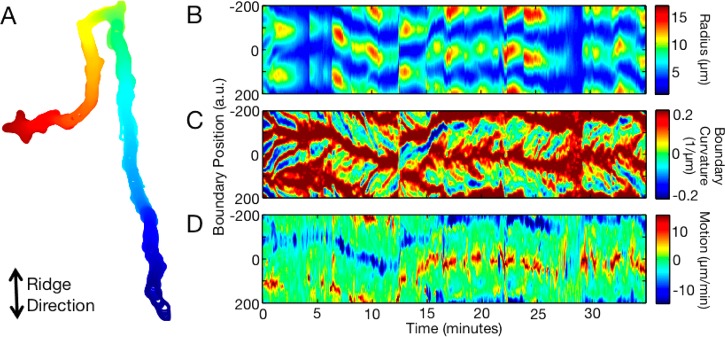
Cells have oscillatory shape dynamics. (A) Shape of a cell migrating on nanoridges spaced 0.4 μm apart. The shape’s color represents time, with the initial cell shape colored red and the final shape colored blue. The long stretches of straight motion and the two right-angle turns perpendicular to the ridges are not typically observed when D. discoideum migrates on flat surfaces. The shape dynamics of this cell are represented in panels B and C. (B) Cell elongation is oscillatory. Here, the color represents the distance from each boundary point to the centroid. Elongated shapes are shown as red and blue, whereas more circular shapes are green. (C) Local shape dynamics are also oscillatory. In this plot of boundary curvature, red represents regions of large positive boundary curvature and blue represents regions of large negative curvature. Regions of high curvature travel from the front to the back of the cell. (D) Local boundary motion of the cell. Red represents protrusive motion, and blue represents retractive motion.