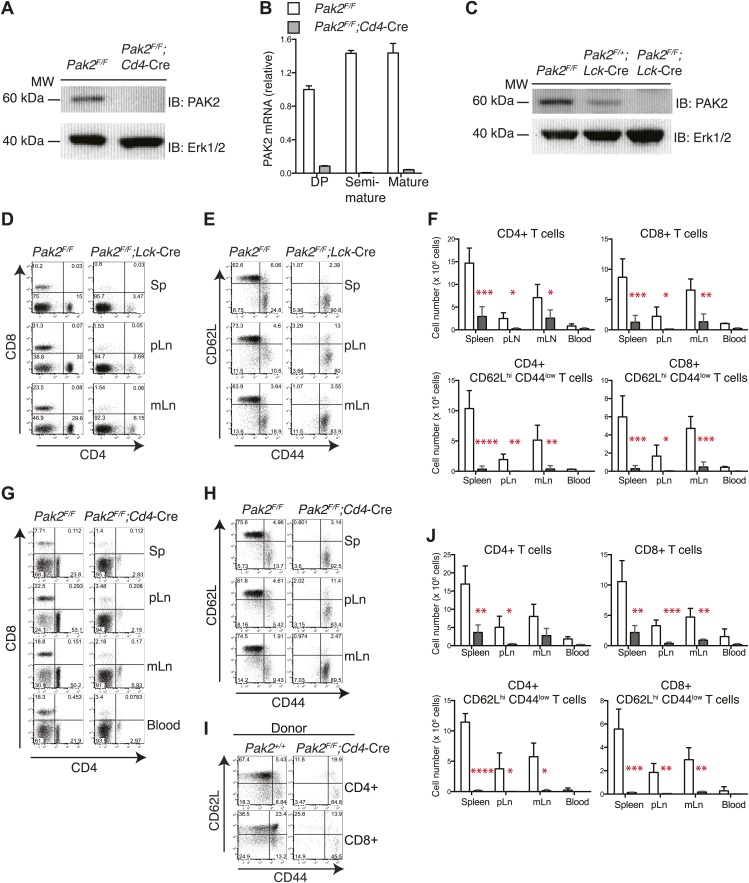
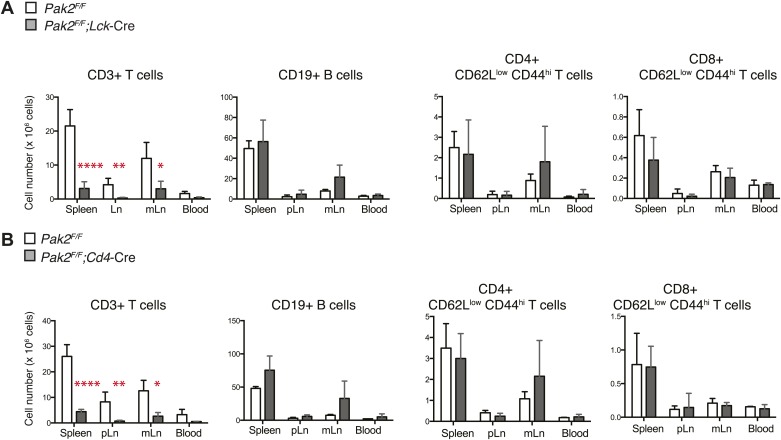
Figure 1. T cell lymphopenia in T cell-specific Pak2-deficient mice.
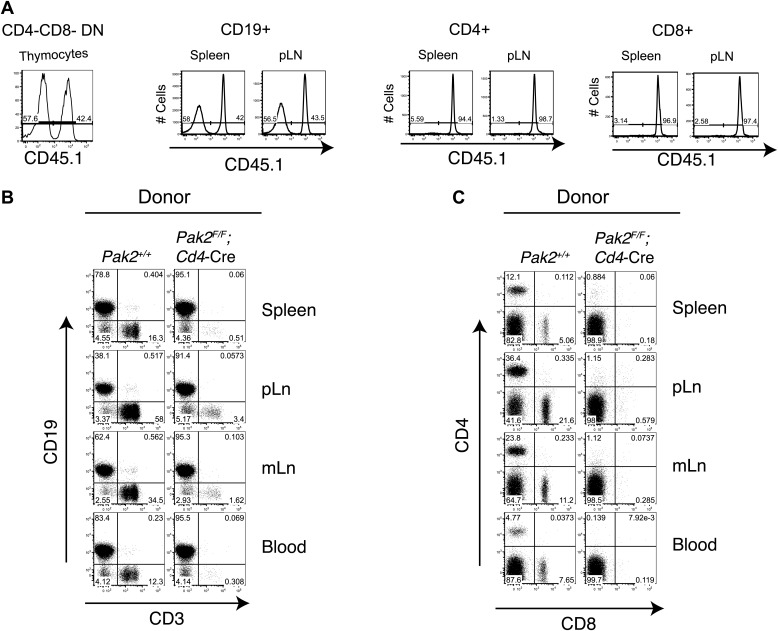
(A) Western blot analysis using anti-Pak2 antiserum and cell lysates from the thymus of Pak2F/F (WT), and Pak2F/F;Cd4-Cre (KO) mice. Anti-Erk1/2 antibody was used as loading control. Shown are representative of two independent experiments. (B) Quantitative PCR analysis of Pak2 mRNA expression in DP, semi-mature and mature CD4SP thymocytes. Shown are Pak2 mRNA levels from DP, semi-mature and mature CD4SP thymocytes relative to Pak2F/F DP thymocytes (error bars; SD). Data are representative of two independent experiments. (C) Western blot analysis using anti-PAK2 and cell lysates from the thymi of Pak2F/F (WT), Pak2F/+;Lck-Cre (HET) and Pak2F/F;Lck-Cre (KO) mice. (D) Representative flow cytometry analyses of CD4 and CD8 expression on lymphocytes from spleens (n = 5), peripheral lymph nodes (pLn; axillary, brachial and inguinal lymph nodes, n = 4), and mesenteric lymph nodes (mLn, n = 4) from Pak2F/F (WT) and Pak2F/F;Lck-Cre (KO) mice. Numbers in each quadrant represent the percentage of cells in the indicated quadrant. (E) Flow cytometry analyses of CD62L and CD44 on CD4+ T cells from Pak2F/F (WT) and Pak2F/F;Lck-Cre (KO) mice. (F) Quantification of cell numbers of different lymphocyte subsets from Pak2F/F and Pak2F/F;Lck-Cre mice. Error bars: SD (spleen [n = 5 mice per genotype], pLn [n = 4 mice per genotype], and mLn [n = 4 mice per genotype]; blood [n = 2 mice per genotype]). *, 0.01<p<0.05; **, 0.001<p<0.01; ***, 0.0001<p<0.001; ****, p<0.0001 (unpaired two-tailed Student’s t test). (G) Representative flow cytometry analyses of CD4 and CD8 expression on lymphocytes from spleen, pLn, mLn, and blood from Pak2F/F (WT) and Pak2F/F;Cd4-Cre (KO) mice. Spleen (n = 4 mice), pLn (n = 4 mice), mLN (n = 3) and blood (n = 2 mice). (H) Flow cytometry analyses of CD62L and CD44 within CD4+ T cells from Pak2F/F and Pak2F/F;Cd4-Cre mice. (I) Absence of naïve (CD62Lhi CD44low) CD4 or CD8 T cells generated from Pak2F/F;Cd4-Cre donor bone marrow cells in 1:1 mixed bone marrow chimeras. Data shown are representative of five bone marrow chimeras. (J) Quantification of cell numbers of different subsets from Pak2F/F and Pak2F/F;Cd4-Cre mice. Error bars: SD (spleen [n = 4 mice per genotype], pLn [n = 4 mice per genotype], mLn [n = 3 mice per genotype], blood [n = 2 mice per genotype]). *, 0.01<p<0.05; **, 0.001<p<0.01; ***, 0.0001<p<0.001; ****, p<0.0001 (unpaired two-tailed Student's t test). See Figure 1—figure supplements 1 and 2.


