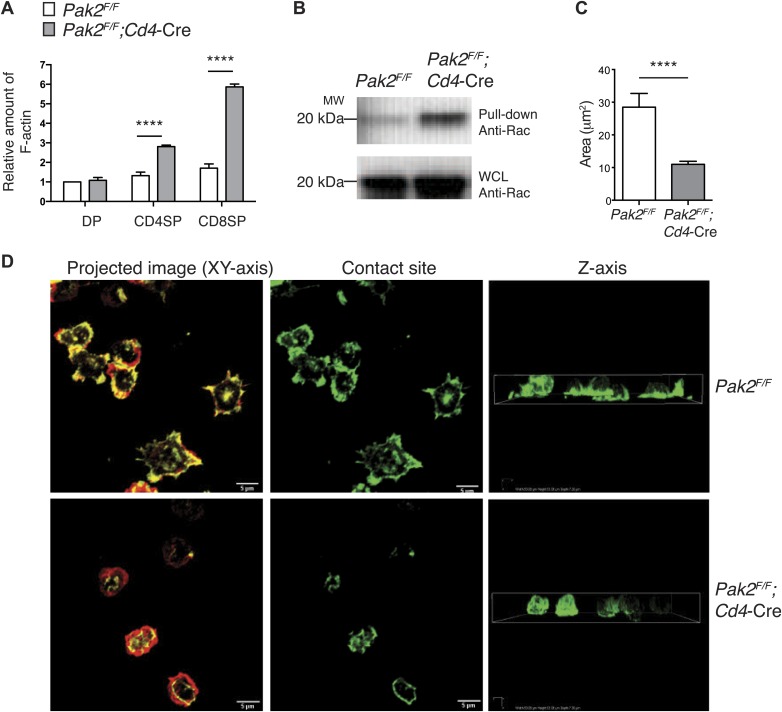
Figure 8. Pak2 regulates actin dynamics of CD4SP thymocytes.
(A) Increased actin polymerization in resting DP, CD4 and CD8 SP thymocytes from Pak2F/FCd4-Cre mice. The mean fluorescence intensity of phalloidin-Alexa488 in the DP, CD4SP and CD8SP thymocyte populations was normalized to the value of WT DP thymocytes at rest. (error bars; SEM, n = 3). ****, p<0.0001 (B) Increased activation of Rac1 at resting from Pak2F/F;Cd4-Cre thymocytes using Rac1 pull-down assay. WCL; whole cell lysates. Shown are data representative of three independent experiments. (C) Spreading areas of CD4SP thymocytes on the cover slips. Cells were allowed to spread for 60 min on coverslips coated with anti-CD3. Z-stack images of F-actin staining of the cells were collected and spreading areas where cells contact the cover slips were analyzed. Shown are data representative of three independent experiments. (error bars; SEM, Pak2F/F [n = 21], Pak2F/F;Cd4-Cre [n = 25]). ****, p<0.0001. (D) T cell spreading and actin polymerization triggered by plate-bound TCR stimulation. Shown are z-stack images of the cells from the contact sites where T cells touch the cover slides to the top of the cells. Left panels; maximal projection of z-stack images of F-actin staining (F-actin staining at the contact site [green] and F-actin staining of the rest of the z-stacks [red]). Scale bar: 5 μm. Middle panels: F-actin staining on the contact site to visualize cell spreading. Right panels: z stack images of F-actin were complied and reconstructed as a 3D image. Shown is the orthogonal image viewed from the z-axis. Shown are data representative of three independent experiments.

