. 2014 May 13;3:e02242. doi: 10.7554/eLife.02242

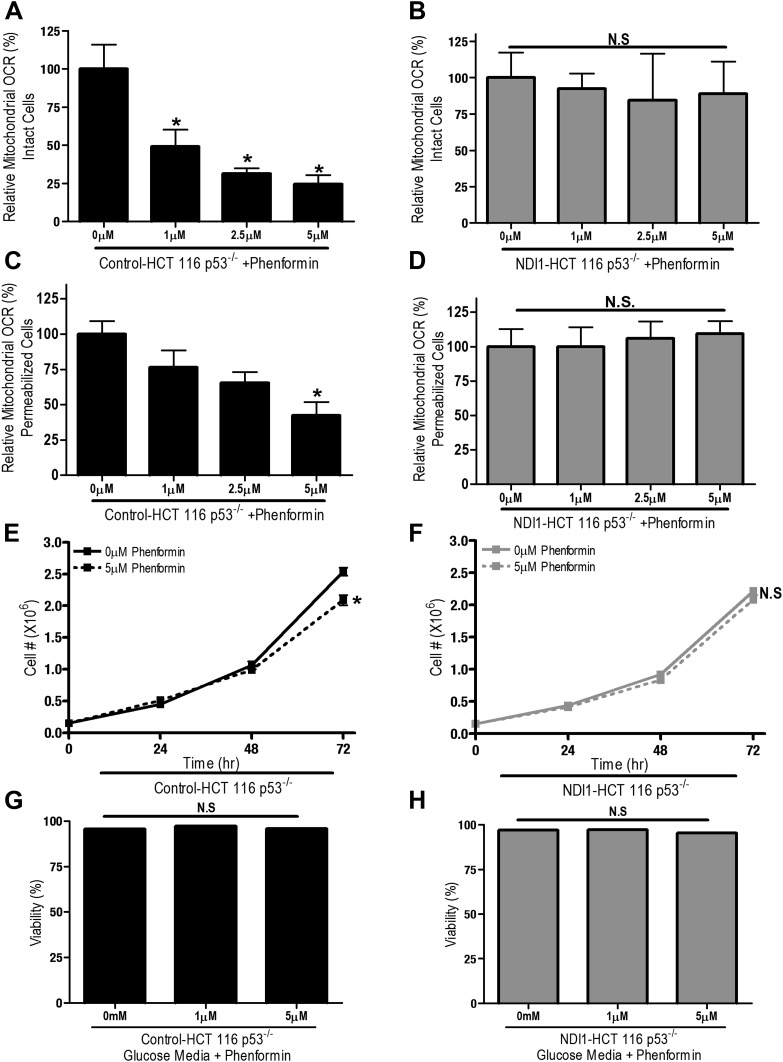
Figure 3. Phenformin decreases cell proliferation by inhibiting mitochondrial complex I.

(A) Relative mitochondrial oxygen consumption rate (OCR) of intact Control-HCT 116 p53−/− and (B) NDI1-HCT 116 p53−/− cells treated with phenformin in complete media for 24 hr. (C) Relative complex I (2 mM malate, 10 mM pyruvate, 10 mM ADP)-driven oxygen consumption rate of saponin permeabilized Control-HCT 116 p53−/− cells and (D) NDI1-HCT 116 p53−/− cells treated with phenformin for 20 min in mitochondrial assay buffer. (E) Cell number of Control-HCT 116 p53−/− cells and (F) NDI1-HCT 116 p53−/− cells 24, 48, and 72 hr post treatment with 0 or 5 µM phenformin in complete media. (G) Percentage of live Control-HCT 116 p53−/− or (H) NDI1-HCT 116 p53−/− treated with metformin for 72 hr followed in complete media. Error bars are SEM (Relative OCR n = 5; Cell number n = 4). * indicates significance p<0.05.

DOI: http://dx.doi.org/10.7554/eLife.02242.008

Figure 3.

Figure 3—figure supplement 1. Metformin inhibits mitochondrial complex I of CCL16 cells.

Figure 3—figure supplement 1.

(A) Relative mitochondrial oxygen consumption rate of Control-CCL16 cells and (B) NDI1-CCL16 cells treated with metformin in complete media for 20 min. (C) Percentage of live Control-CCL16, (D) B2-CCL16, or (E) NDI1-CCL16 treated with metformin for 16 hr in media with galactose was substituted for glucose. (F) Cell number of Control-CCL16 cells, (G) B2-CCL16 and (H) NDI1-CCL16 cells 48 and 72 hr post treatment with 2 mM or 4 mM metformin in complete media. Error bars are SEM (n = 4). * indicates significance p<0.05.
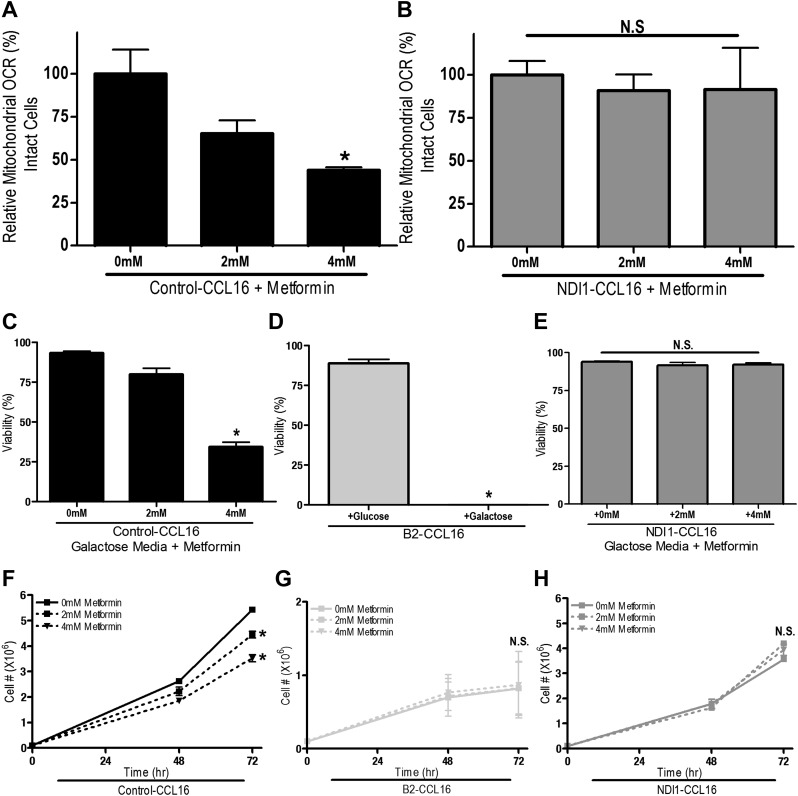
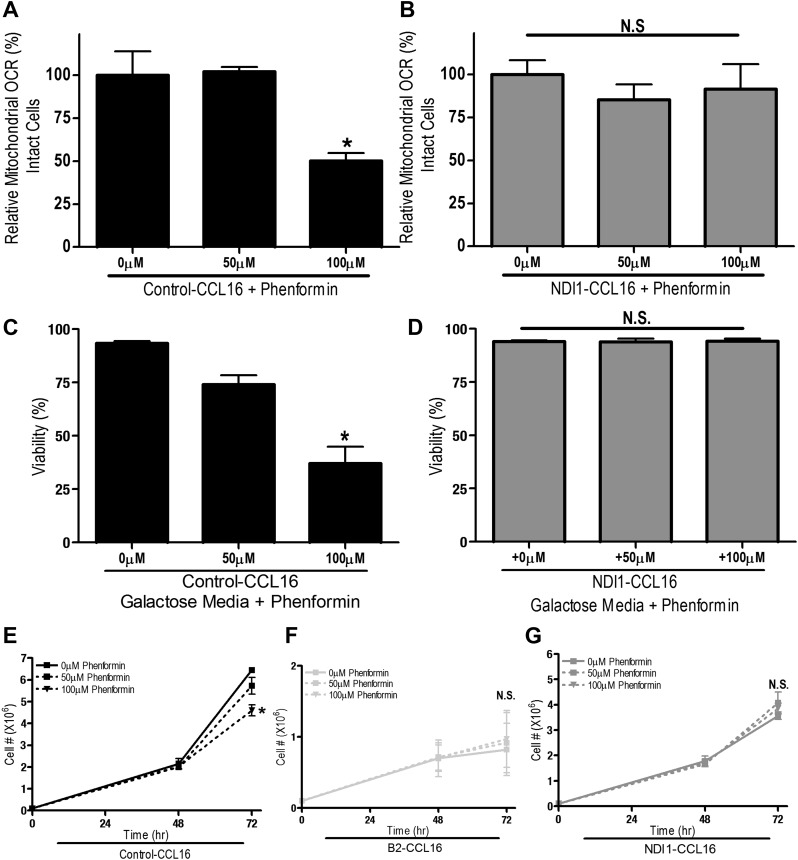
Figure 3—figure supplement 2. Phenformin inhibits mitochondrial complex I of CCL16 cells.

Figure 3—figure supplement 2.

(A) Relative mitochondrial oxygen consumption rate of Control-CCL16 cells and (B) NDI1-CCL16 cells treated with metformin in complete media for 20 min. (C) Percentage of live Control-CCL16 or (D) NDI1-CCL16 treated with metformin for 16 hr in media with galactose was substituted for glucose. (E) Cell number of Control-CCL16 cells, (F) B2-CCL16 and (G) NDI1-CCL16 cells 48 and 72 hr post treatment with 50 μM or 100 μM phenformin in complete media. Error bars are SEM (n = 4). * indicates significance p<0.05.