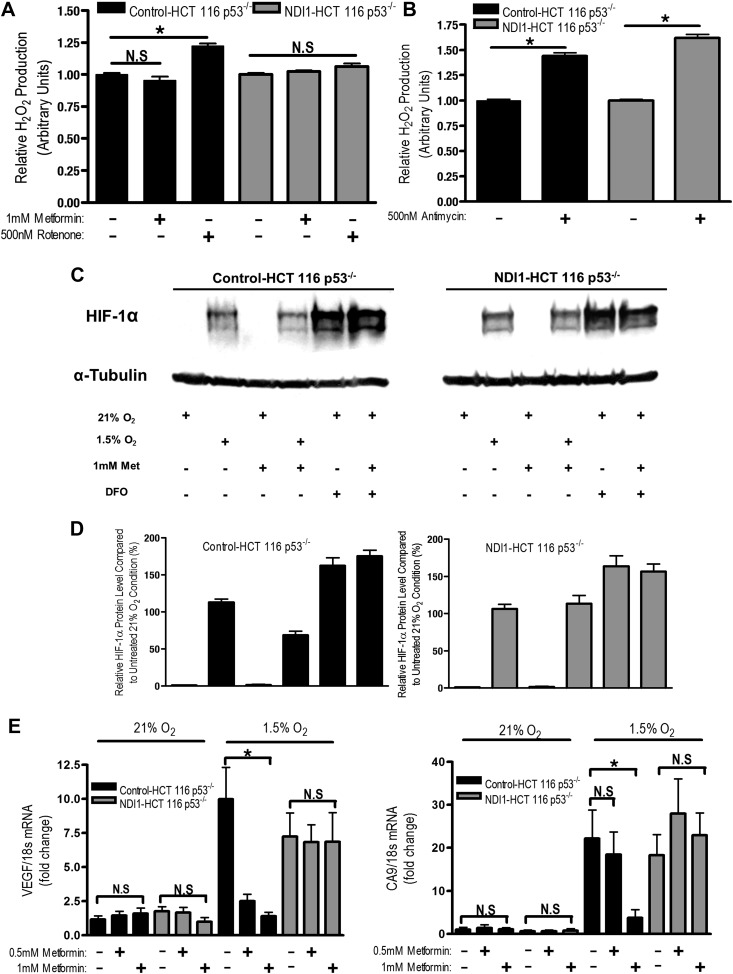
Figure 6. Metformin reduces HIF-1 activation through inhibition of mitochondrial complex I.
(A and B) H2O2 levels emitted by mitochondria isolated from Control-HCT 116 p53−/− and NDI1-HCT 116 p53−/− cells respiring on 2 mM malate and 10 mM pyruvate. Mitochondria were treated with 1 mM Metformin, 500 nM rotenone, 500 nM Antimycin, or left untreated. H2O2 levels were measured using Amplex Red. (C) Levels of HIF1α protein in Control-HCT 116 p53−/− and NDI1-HCT 116 p53−/− cells treated with 0 or 1 mM metformin for 24 hr, then placed in normoxia (21% O2), hypoxia (1.5% O2) or treated with Deferoxamine (DFO) for 8 hr. (D) Quantification of HIF1α protein levels from panel C. (E) Hypoxic-induced expression of HIF target genes in Control-HCT 116 p53−/− and NDI1-HCT 116 p53−/− treated with 0, 0.5 mM or 1 mM metformin for 24 hr following treatment with normoxia or hypoxia for 16 hr. Error bars are SEM (n = 3 for Amplex Red; Blot is representative of four independent blots quantified in D, n = 4 for gene expression). * indicates significance p<0.05.

