. 2014 May 13;3:e02242. doi: 10.7554/eLife.02242

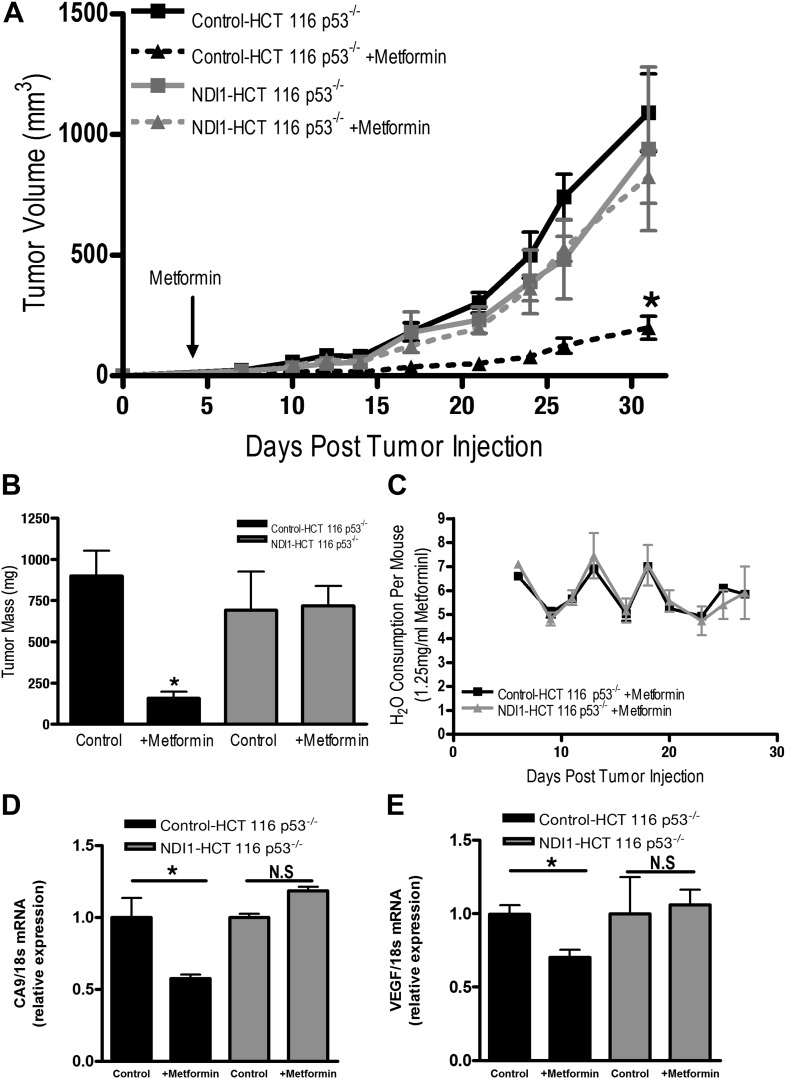
Figure 7. Metformin inhibits mitochondrial complex I to diminish tumor growth.

(A) Average tumor volume in mice injected with 3 × 10⁶ Control-HCT 116 p53−/− or NDI1-HCT 116 p53−/− cells injected into the left flank of J:Nu mice. Mice were given ad libitum, water free of metformin (squares) or were treated with 250 mg/kg of metformin in the drinking water starting 4 days post tumor injection (triangles). (B) Average tumor mass from mice injected with 3 × 10⁶ Control-HCT 116 p53−/− or NDI1-HCT 116 p53−/− cells injected into the left flank of J:Nu mice after 32 days. (C) Average daily water consumption of mice treated with metformin (1.25 mg/ml). (D) HIF target genes expression measured in Control-HCT 116 p53−/− or NDI1-HCT 116 p53−/− tumors treated with metformin. Error bars are SEM (n = 8 per group for tumor study, n = 8 for H2O consumption, error bars represent standard deviation of two cages with four mice house in each cage, n = 3 for gene expression). * indicates significance p<0.05.

DOI: http://dx.doi.org/10.7554/eLife.02242.014

Figure 7.

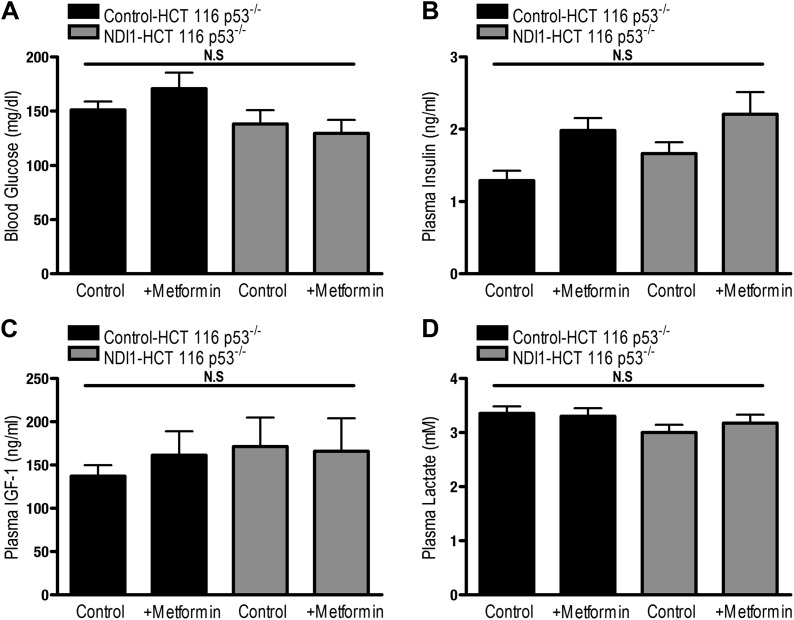
Figure 7—figure supplement 1. Metformin treatment of tumor bearing mice does not alter blood glucose, plasma lactate, IGF-1, and insulin levels.

Figure 7—figure supplement 1.

(A) Blood glucose levels of mice injected with 3 × 10⁶ Control-HCT 116 p53−/− or NDI1HCT 116 p53−/− cells into the left flank of J:Nu mice. Mice were treated with water free of metformin or were treated with 250 mg/kg of metformin ad libitum in the drinking water starting 4 days post tumor injection for 27 days (Figure 4). (B) Plasma insulin, (C) IGF-1, and (D) lactate levels from tumor bearing mice from Figure 4 27 days after beginning metformin treatment. Error bars are SEM (n = 8 per group). * indicates significance p<0.05.
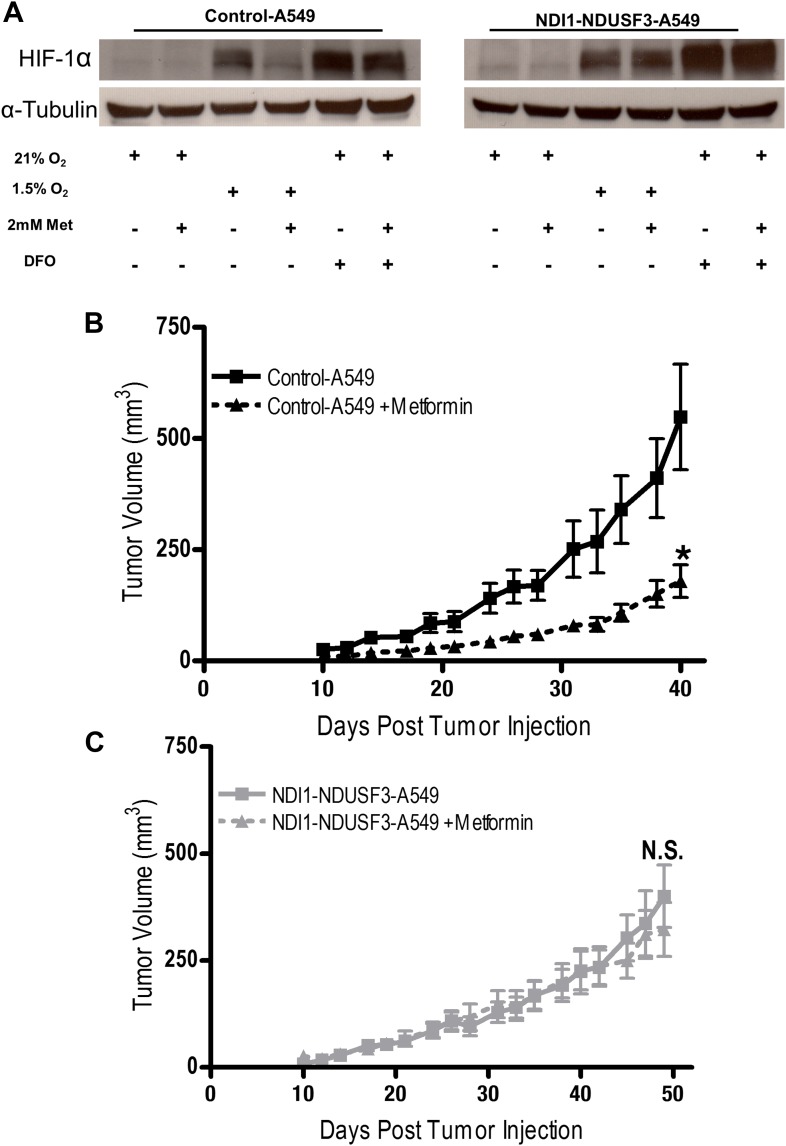
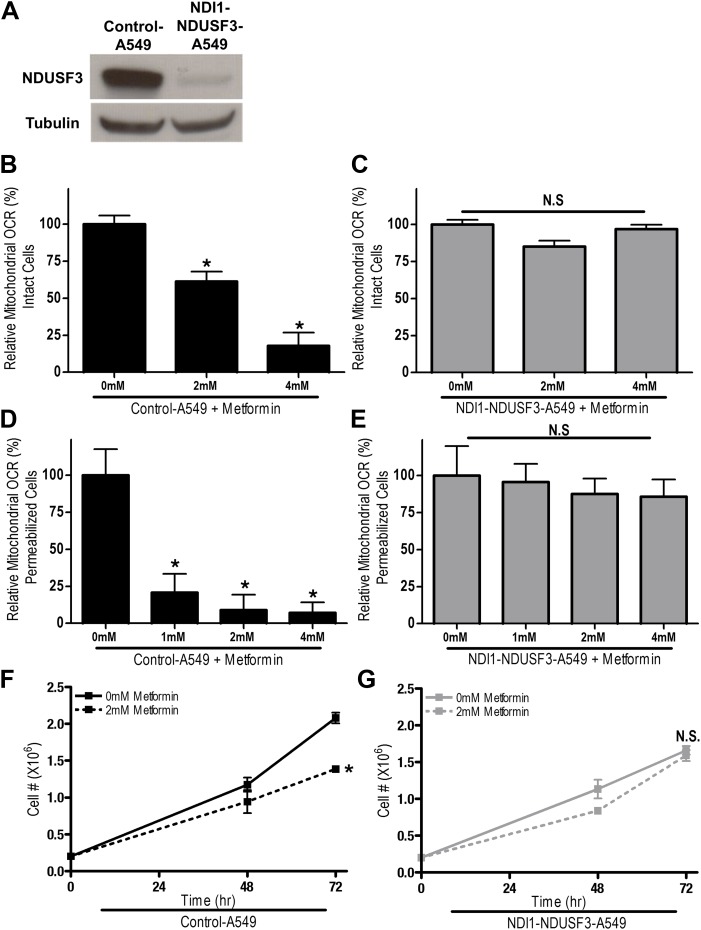
Figure 7—figure supplement 2. Metformin inhibits cellular proliferation and pro- proliferative signaling via complex I inhibition.

Figure 7—figure supplement 2.

(A) Immunoblot for the complex I protein NDUFS3 in Control-A549 cells expressing control shRNA and NDI-A549 cells expressing a shRNA specific for the NDUFS3 subunit. (B) Relative mitochondrial oxygen consumption rate (OCR) of intact Control-A549 and (C) NDI1-NDUFS3-A549 cells treated with metformin in complete media for 20 min. (D) Relative complex I (2 mM malate, 10 mM pyruvate, 10 mM ADP)-driven oxygen consumption rate of saponin permeabilized Control-A549 cells and (E) NDI1-NDUFS3-A549 cells treated with metformin for 20 min in mitochondrial assay buffer. (F) Cell number of Control-A549 and (G) NDI1-NDUFS3-A549 cells 24, 48, and 72 hr post treatment with 2 mM metformin in complete media. Error bars are SEM (OCR n = 4; Cell proliferation n = 3). * indicate significance p<0.05.

Figure 7—figure supplement 3. NDI1 expressing A549 cells are refractory to metformin treatment in a xenograft model of tumor growth.

Figure 7—figure supplement 3.

(A) Hypoxic induction of HIF1a in Control-A549 and NDI1-A549 cells treated with 0 or 2 mM metformin for 24 hr then placed in normoxia (21% O2), hypoxia (1.5% O2) or treated with Deferoxamine (DFO) for 8 hr. (B) Average tumor volume in mice injected with 3 × 10⁶ Control-A549 cells or (C) 3 × 10⁶ NDI1-NDUFS3-A549 cells injected into the left flank of nu/nu mice. Mice were treated with water free of metformin (squares) or were treated with 300 mg/kg of metformin in the drinking water (triangles) 1 week prior to tumor and injection and continued throughout the duration of the study. Error bars are SEM (n = 10 per group). * indicate significance p<0.05.