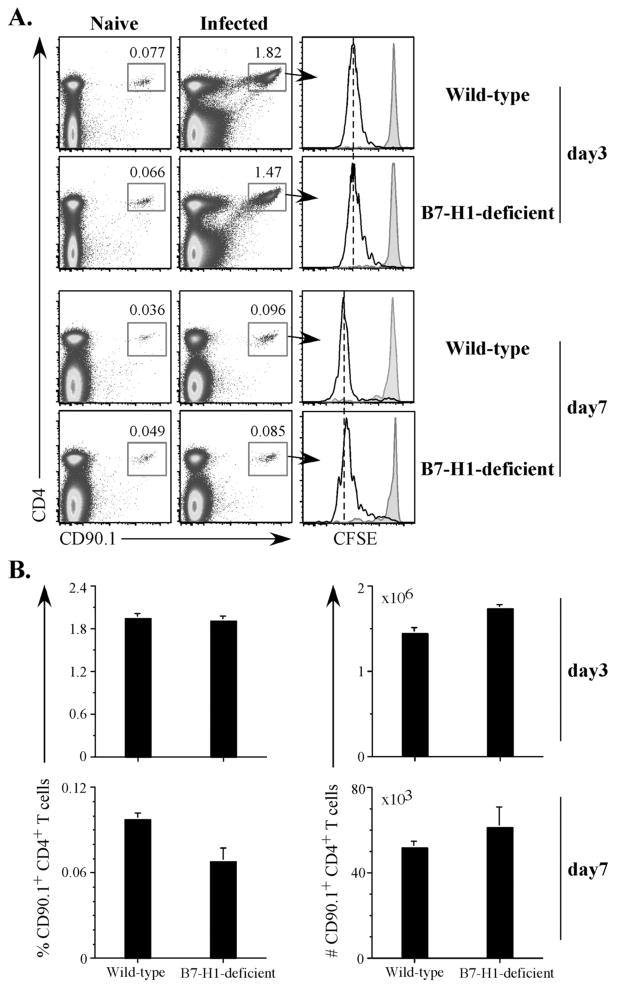
Figure 4. Clonal expansion of Salmonella-specific SM1 CD4 T cells in B7-H1-deficient mice.
Wild-type and B7-H1-deficient mice were adoptively transferred with 500,000 CFSE-labeled SM1 T cells and infected intravenously the following day with 5×10⁵ attenuated Salmonella, BRD509. On day 3 and day 7, spleens were harvested from uninfected (naïve) or infected mice, and stained with antibodies specific for CD4 and CD901 to detect SM1 T cells. (A) Representative FACS plots showing the percentage of SM1 T cells on day 3 and day 7. Histograms show representative CFSE dilution after gating on SM1 T cells. Black lines show SM1 T cells from infected mice and gray shading shows naïve mice at each time point. (B). Bar graphs show the percentage (left) and absolute number (right) ± SEM of SM1 T cells from spleens of infected Wild-type and B7-H1-deficient mice on day 3 (top) and day 7 (bottom) after Salmonella infection. These data represent two independent experiments with 5 mice per group.

