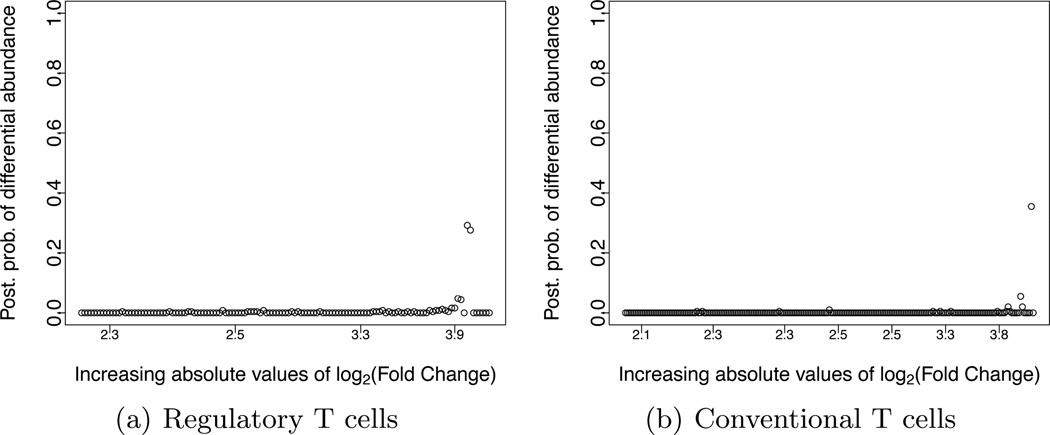
Fig. 6.
Comparison of TCR sequence abundances between diabetic and health mice: posterior probability of differential abundances across distinct TCR sequences as function of their ranking versus the corresponding ranking based on the absolute values of log2 Fold Changes as computed in EdgeR for (a) regulatory T cells (b) conventional T cells.

