
Figure 2. Proteomics data for 27 HCC patients.
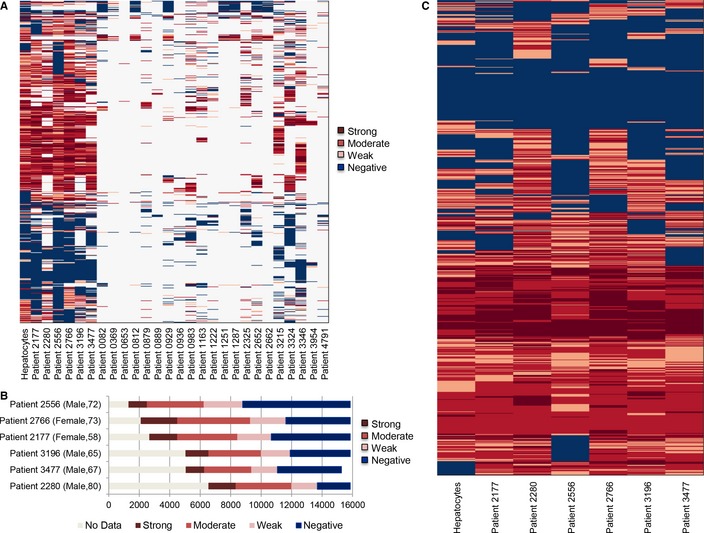
- Clustering of the generated proteomics data between 27 different HCC patients showed notable differences. The color indicates the protein expression differences between tissue samples.
- Due to the coverage of the proteomics data, we focused on the reconstruction of the personalized models for six HCC patients. The number of the evaluated proteins in each HCC patients varies between 9,312 and 14,561.
- The expression level of 4,936 proteins measured in all six HCC patients and the proteomics data showed notable differences between the HCC patients and hepatocytes.