
Figure 2. DNase‐HS sites are main independent determinants of DNA replication timing.
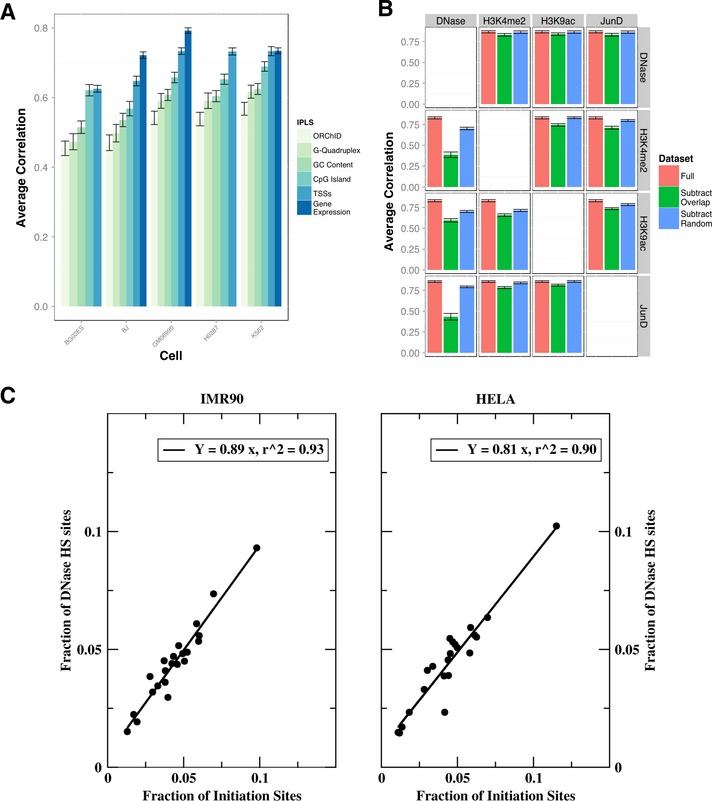
- Simulations based on genome sequence features (GC content, CpG islands), or local genome conformation (ORChID, G‐quadruplex), RefSeq annotated transcription start sites (TSS) and gene expression levels (where available) in five cell lines. Shown is the correlation with the Hansen (Han) dataset averaged over 22 autosomal chromosomes, and error bars represent the standard error of the mean.
- Mutual independence of representative top‐ranking ENCODE marks (DNase, JunD, H3K4me2, H3K9ac) is probed by eliminating co‐localized genomic marks in pairwise comparisons. The results of these 4 (datasets) × 3 (overlaps) = 12 sets of simulations are presented in a 4 × 4 matrix format: rows indicate the dataset that was used to generate the initiation probability landscape (IPLS), and columns indicate the subtracted dataset. Each panel plots the correlation to the experimental timing data in K652 cells (the only set for which all annotations were available) for the full dataset (red), the non‐co‐localized marks (green), and a “random” dataset (blue) from which the same number of (not necessarily overlapping) marks was removed. Error bars represent standard error of the mean.
- The number of initiation sites had been shown earlier to be non‐trivially distributed across chromosomes (Besnard et al, 2012). Comparison of the number of DNase‐HS sites in IMR90 and HELA with the number of initiation sites on each chromosome reveals a tight correlation between the two. Each data point in the plot represents the fraction (sum = 1) of initiation and DNase‐HS sites, respectively, on a autosomal chromosome (see also Supplementary Fig S6).