
Figure 3. Mechanistic model is highly reflective of the underlying DNA replication timing biology.
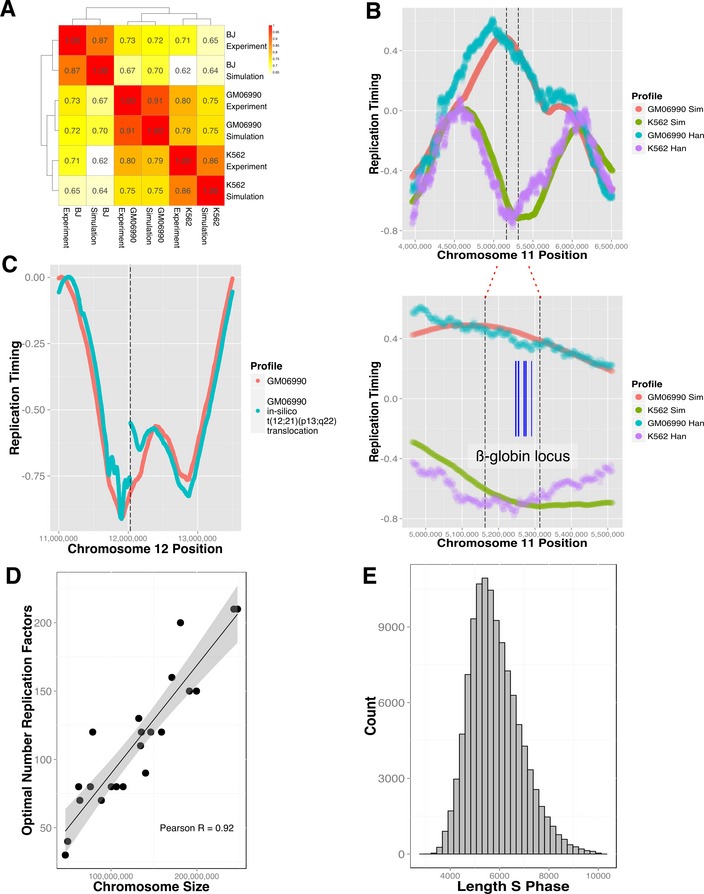
- Hierarchical clustering and correlations heatmap of simulated and empirical data. Individual correlations (Pearson's) are noted in the matrix for every dataset pair. Simulations are consistently placed closest to the associated experimental data. The stated correlations are based on simulations which were not optimized for flow‐sorter settings.
- Analysis of timing plasticity between simulated GM06990 and K562 cells identified, among other regions, differential timing in the β‐globin locus (indicated by dashed lines, genes marked in blue). Hansen dataset (Han) is shown for reference.
- A translocation event simulated in silico in GM06990 cells qualitatively reproduces the timing discontinuity observed (Wiemels et al, 2000) at a TEL‐AML1 translocation in ALL. Replication profile of translocated (blue line) and normal (red line) are shown on the same genomic axis, and the dashed line signifies the translocation coordinate.
- DNA replication timing profiles were simulated using initiation probability landscape (IPLSs) derived from GM06990 DNase‐HS data, noting the number of replication factors that produced highest correlation for each chromosome. Solid line represents a linear fit (shading area denotes the 95% confidence interval). The linear regression curve estimates that the number of forks per megabase is given by N = 10.24 + 7.9E‐7 * x, where x is chromosome length. The Pearson's correlation between the optimal number of replication forks and chromosome length is 0.92.
- Histogram illustrating the distribution of the lengths of the S‐phase in a simulated asynchronous cycling population of GM06990 cells.