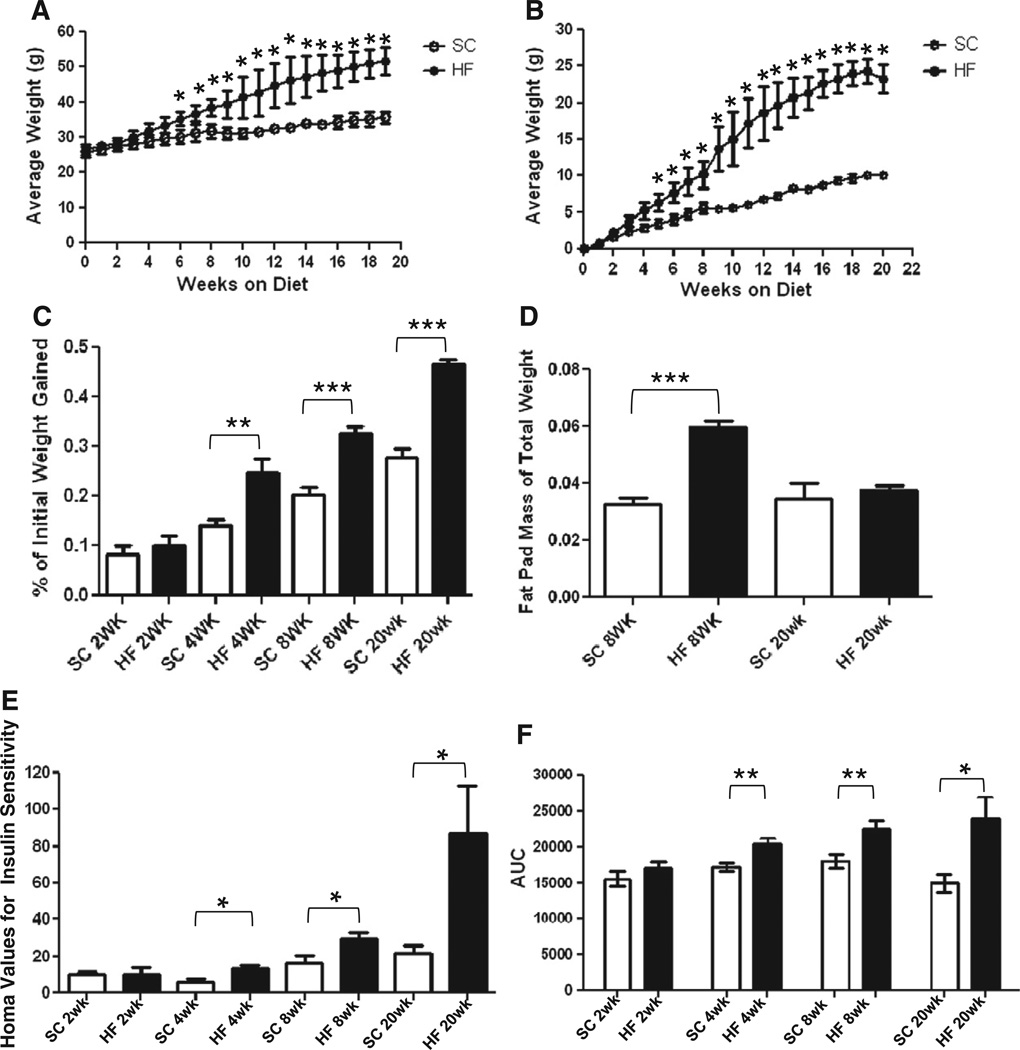
Fig. 1.
C57Bl/6 mice on a HF diet experience hallmarks of obesity and type 2 diabetes. After 6 weeks of HF diet ingestion, mice exhibited greater average weights than their SC counterparts (A; n = 3, *P < 0.05, unpaired t-test). At 4 weeks mice on a HF diet also experience greater total weight gain (B; n = 3, *P < 0.05, unpaired t-test) indicating the onset of obesity/overweight between 4 and 6 weeks. This is regardless of initial weight, shown by a greater proportion of initial body weight gain (C) at 4 (n = 16, **P < 0.01 unpaired t-test), 8 (n = 16, ***P < 0.001, unpaired t-test) and 20 weeks (n = 6–7). HF diet mice had greater epididymal fat pad mass expressed as a percentage of total body weight (D) at 8 (n = 16, ***P < 0.001 unpaired t-test) but not 20 weeks of HF diet ingestion (n = 6–7). HOMA values for insulin resistance were higher in mice on a HF diet at 4, 8 and 20 week time-points (E; n = 5, **P < 0.01; n = 6–8, **P < 0.01; n = 5–6, *P < 0.05; all unpaired t-test). After generating a curve of blood glucose levels pre and post 1 g/kg−1 IP glucose injection, area-under-curve (AUC) values became greater in 4, 8 and 20 week mice (F; n = 4, *P < 0.05; n = 9–13, *P <0.05; n = 5–6, *P < 0.05; all unpaired t-test) indicating glucose intolerance.

