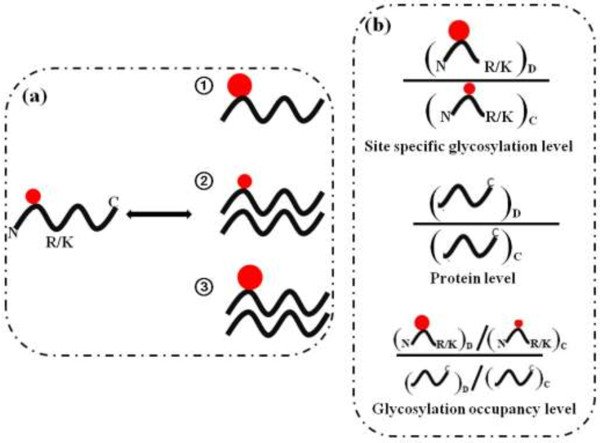
Figure 3.
The common quantitative aim and related strategies for N-glycoproteome. (a) Interpreting alterations in glycoproteomics. ① Changes in site specific glycosylation level; ② Changes in protein expression level; ③ Changes in glycosylation occupancy level. Glycosylation site is depicted by a filled red circle. (b) Specific quantitative strategies for different goals. “D” denote disease sample, “C” denote control sample.

