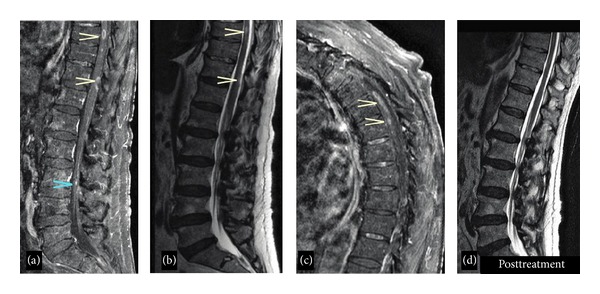
Figure 1.

(a) Thoracic and lumbar sagittal MRI and T1 postgadolinium contrast image demonstrating areas of intramedullary enhancement at the levels of T9 and T11, as well as cauda equina enhancement (blue arrow). (b) Sagittal T2 image showing corresponding areas of T2 hyperintensity at the same levels. (c) Sagittal T1 postgadolinium contrast demonstrates enhancement at multiple thoracic levels. (d) Sagittal T2 image after 6 weeks of antiviral treatment demonstrating near resolution of these changes (postcontrast image, not shown, demonstrates resolution of enhancement).
