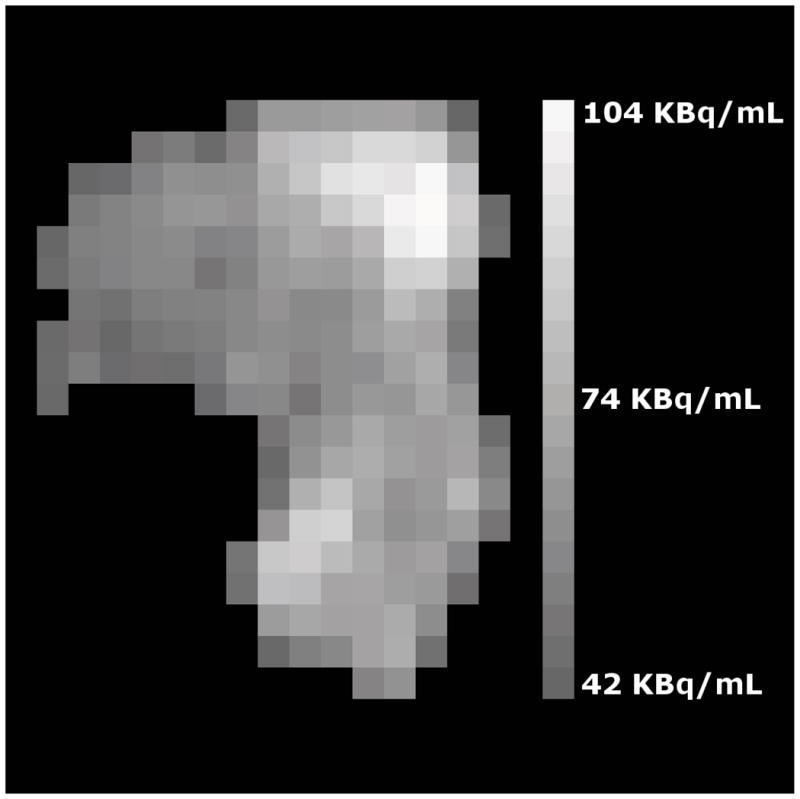
Figure 1.

A trans-axial cross-section of a cancer of the uterine cervix is shown as assayed by FDG-PET where intensity variations are clear. For example, the upper-right corner of the tumor is brightest and several darker spots are visible throughout. These intensity variations represent variations in FDG uptake within the tumor. The vertical edge of the image corresponds to 10 cm within the patient.
