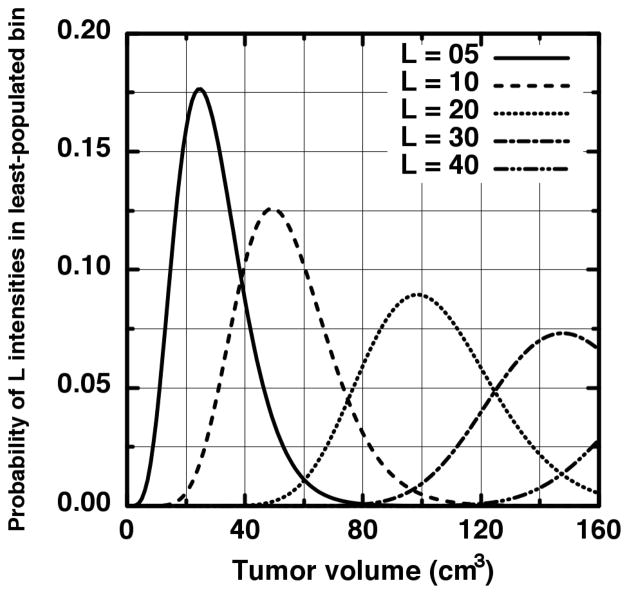
Figure 3.
The probability that precisely L samples fall into the last intensity bin given in Figure 2 is plotted for several L values. It is seen that up to 100 cm3 the probability curves from higher numbers of samples (40 > L > 5) are not zero and therefore contribute to the probability that at least five samples fall into the final intensity bin.

