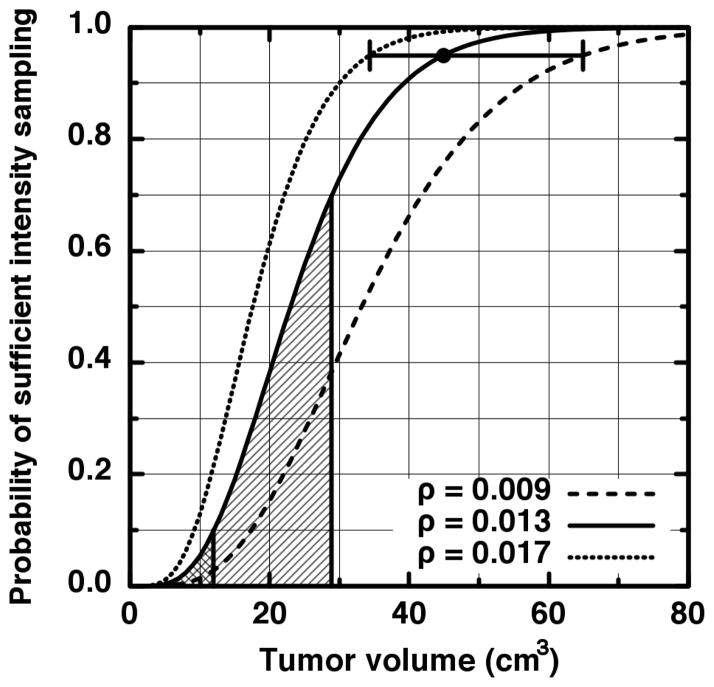
Figure 4.
The probability (solid curve) that at least five samples fall into the last intensity bin given in Figure 2. The large dot indicates the level of 95% certainty that adequate sampling of the intensity distribution has occurred. The other curves represent the probabilities computed from 1.96 times one standard error above or below the ensemble average last bin probability. The horizontal error bar extends from 34 cm3 (531 voxels) to 65 cm3 (1016 voxels).

