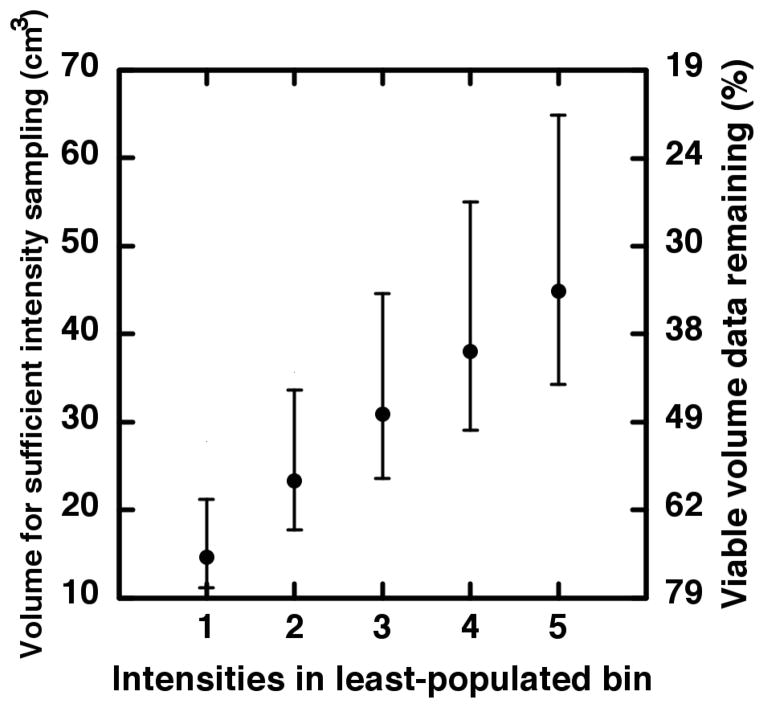
Figure 5.
On the left-hand scale, the volume associated with sufficient sampling is plotted versus increasingly strict criterion for adequate sampling of the intensity distribution. The non-linear right-hand scale indicates approximately how much of our volume data remains after imposition of each adequate-sampling criterion.

