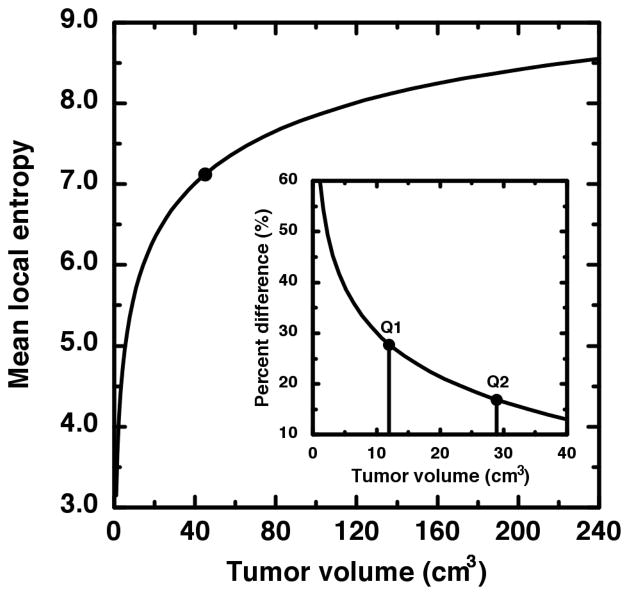
Figure 6.
The ensemble average of the root-mean-square local entropy is plotted as a function of image size (tumor volume). The local entropy is much less sensitive to volume for volumes greater than 45 cm3 (large dot). The inset shows the percent difference of the mean local entropy from the value averaged over only the large volumes. The vertical lines indicate the first and second quartile of our tumor volume data. It is thus seen that the first quartile exhibits large deviation from the large-volume average.

