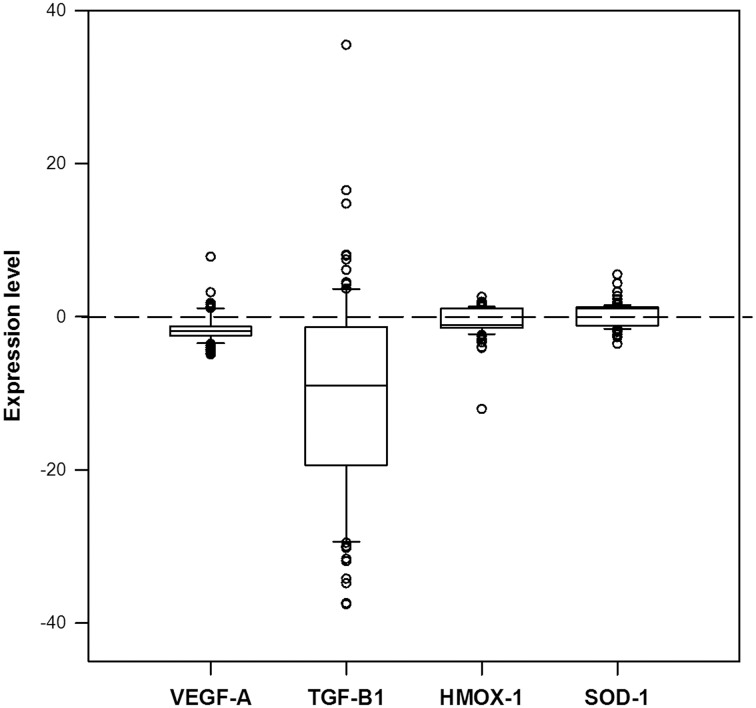
Figure 1.
Distribution of gene expression levels in the PE cases. Selected genes (VEGF-A, TGF-β1, HMOX-1 and SOD-1, respectively) were analyzed by real-time PCR. Total PBMC RNA isolated from normal pregnant women (n = 69) and women with PE (n = 108) were analyzed. Gene expression was calculated using the relative standard curve method and was expressed as fold-change relative to the average of expression in the controls.

