
Figure 6.
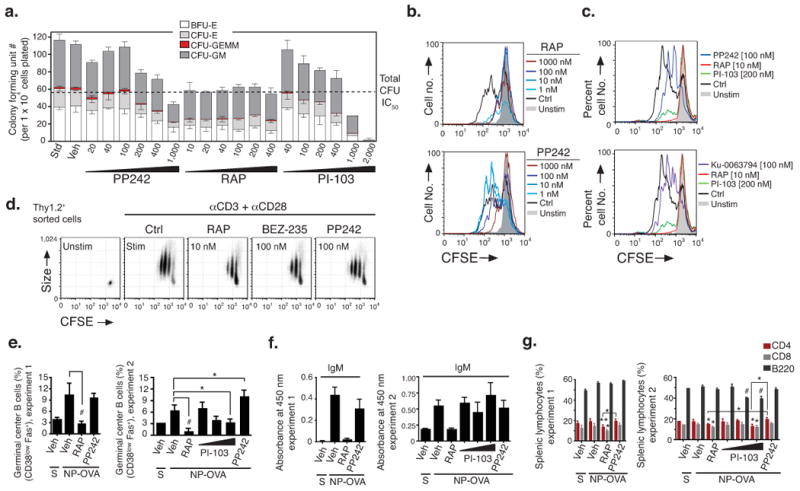
In vitro and in vivo selectivity of PP242 compared to rapamycin. (a) Hematopoietic clonogenic progenitors of bone marrow cells from a healthy human donor were assessed for colony formation in the presence of indicated concentrations of inhibitors. (b–d) Cell division tracking of mouse lymphocytes was done by labeling cells with CFSE before incubation for 3 d with the indicated stimuli. Reduced CFSE fluorescence denotes cell division. The histogram overlays (b–c) show cell division history of CFSE-labeled B cells pretreated with RAP, PP242, PI-103 or Ku-0063794 (15 min) before stimulation with anti-IgM (b) or LPS (c). Dot plots (d) depict CFSE fluorescence versus cell size (forward scatter) of activated T cells pretreated with RAP, PP242 or BEZ-235. Shown are representative examples of 3–5 independent experiments. In (b–c), upper and lower histograms are from same experiment. (e–g) Groups of 3–4 mice were immunized with NP-OVA in alum (i.p.) and immune responses measured 8 days later. Mice were treated with vehicle, RAP (7.5 mg kg−1, i.p., qd), PP242 (60 mg kg−1, p.o., qd), or PI-103 (10, 30 or 60 mg kg−1, i.p., b.i.d.) starting one day before immunization. S = sham immunized. (e) NP-specific IgM in serum were quantified by ELISA (mean ± s.d.); equivalent results were obtained for NP-specific IgG1 (data not shown). (f) Splenic GCB cells (CD38lowFas+, gated on B220+IgD−) and (g) total B cells and T cell subsets were quantified (mean ± s.d.) by flow cytometry.