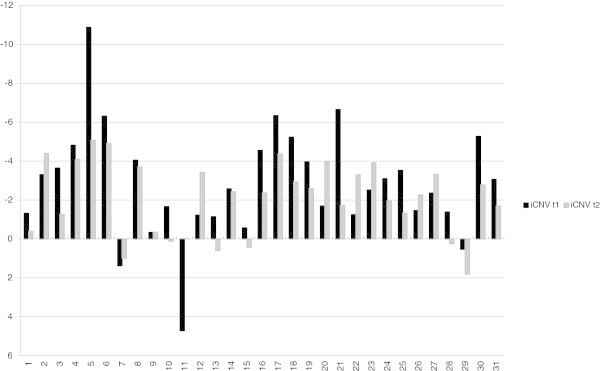
Figure 5.

Illustration of iCNV-dishabituation before the training (measurement 1) and iCNV- habituation after the training (measurement 2). The figure shows mean amplitudes of the iCNV among the blocks of recording for all subjects and the regression line demonstrating the trend of dishabituation or habituation.
