
Figure 2.
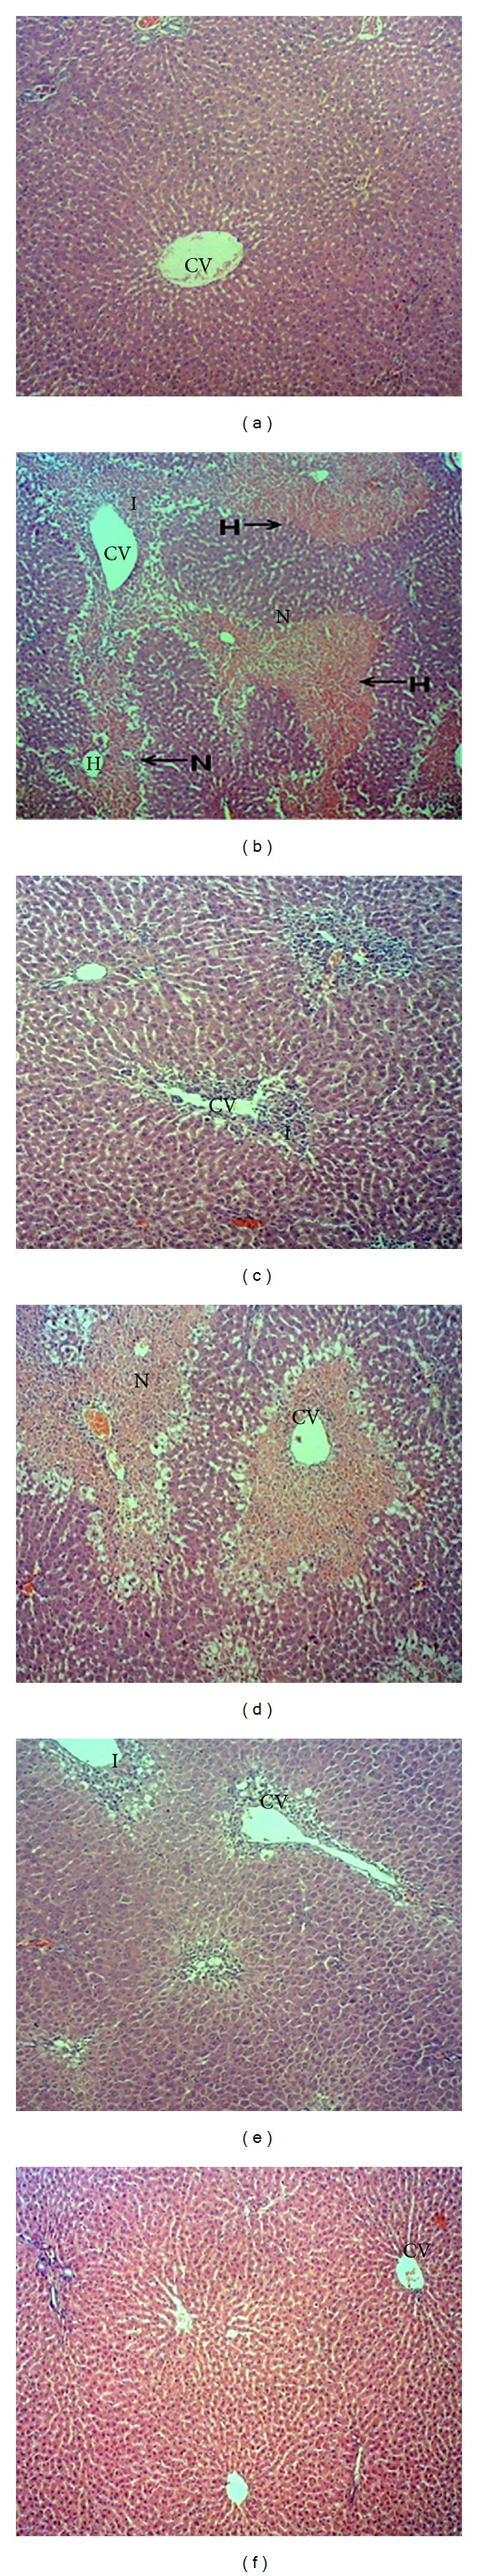
Microscopic observations of liver tissue pretreated with various concentrations of MEMC followed by treatment against PCM-induced liver injury: (a) normal, (b) section of liver tissue of 3 g/kg PCM-treated group (p.o.) showing massive necrosis, haemorrhage, and inflammation, (c) section of 50 mg/kg of N-acetylcysteine liver tissue pretreated on the liver followed by PCM showing preservation of normal hepatocytes, (d) section of pretreated 50 mg/kg MEMC liver tissue followed by PCM showing tissue necrosis and inflammation, (e) section of pretreated 250 mg/kg MEMC liver tissue followed by PCM showing mild inflammation, and (f) section of pretreated 500 mg/kg MEMC liver tissue followed by PCM showing normal histology with mild inflammation (40x magnification). CV: central vein; N: necrosis; I: inflammation; H: haemorrhage.