
Figure 4.
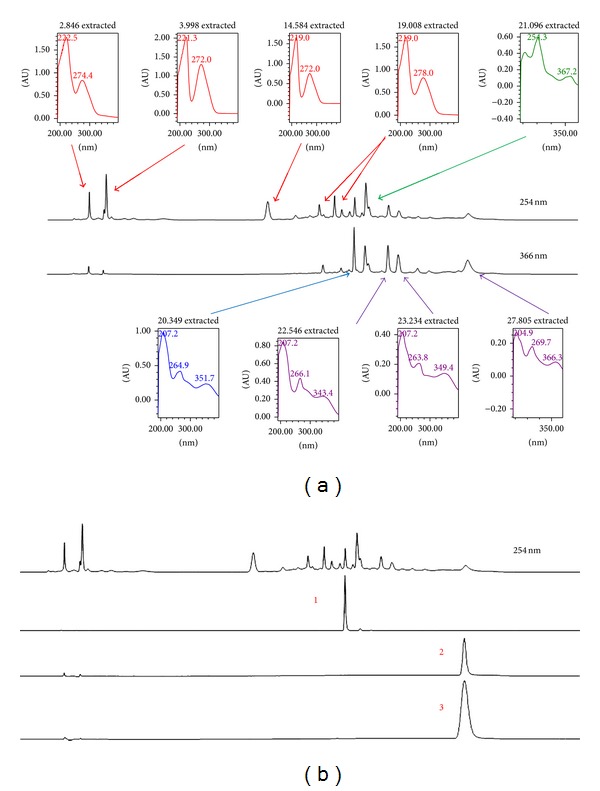
HPLC profile of MEMC. (a) HPLC chromatogram of MEMC at 254 nm and 366 nm. Approximately eleven major peaks were detected at 254 nm with some of them being further highlighted at 366 nm. Each peak was represented by their respective UV-Vis spectra with λ max value. (b) HPLC chromatogram of MEMC at 254 nm compared against several standard pure flavonoids demonstrated the presence of, namely, rutin (1), fisetin (2), and quercetin (3).