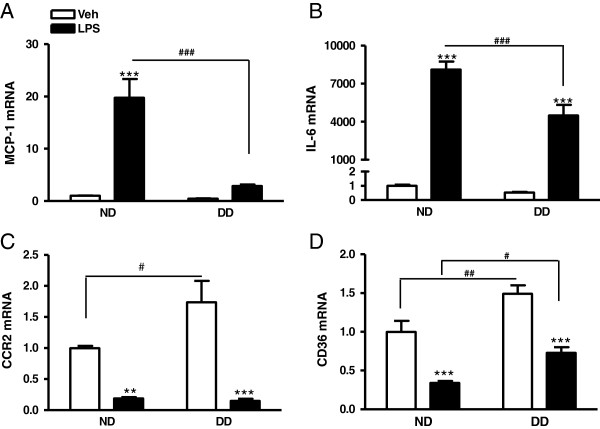
Figure 4.
Deregulated inflammatory response in LPS-stimulated diabetic macrophages. Gene expression of MCP-1 (A), IL-6 (B), CCR2 (C), and CD36 (D) in primary macrophages in the absence and presence of LPS. ND, macrophages from the mice fed a normal diet (n = 9); DD, macrophages from the mice fed a diabetic diet (n = 10). Data were expressed as fold difference compared to vehicle treated ND macrophages. **P <0.01, ***P <0.001 vs. vehicle; #P <0.05, ##P <0.01, ###P <0.001 vs. ND; two way ANOVA with a post-hoc Bonferroni test.

