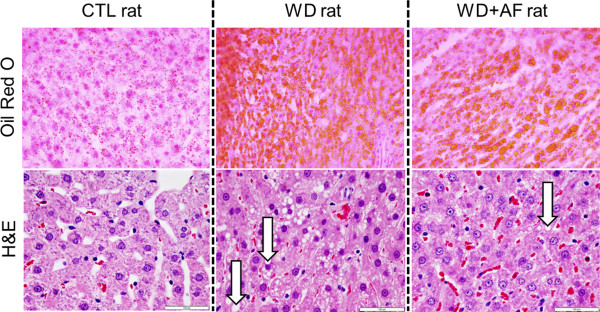
Figure 2.

Representative Oil Red O and H&E photomicrographs. Images were captured using the 10× objective. Upper photomicrographs are Oil Red O images whereby red-orange globules are lipid droplets. Lower photomicrographs are H&E images whereby cytosolic lipid vacuoles are depicted by white arrows in the WD and WD + AF rats; note that all CTL rats presented minimal signs of these vacoules. White bars on H&E stains represent 100 μm markers.
