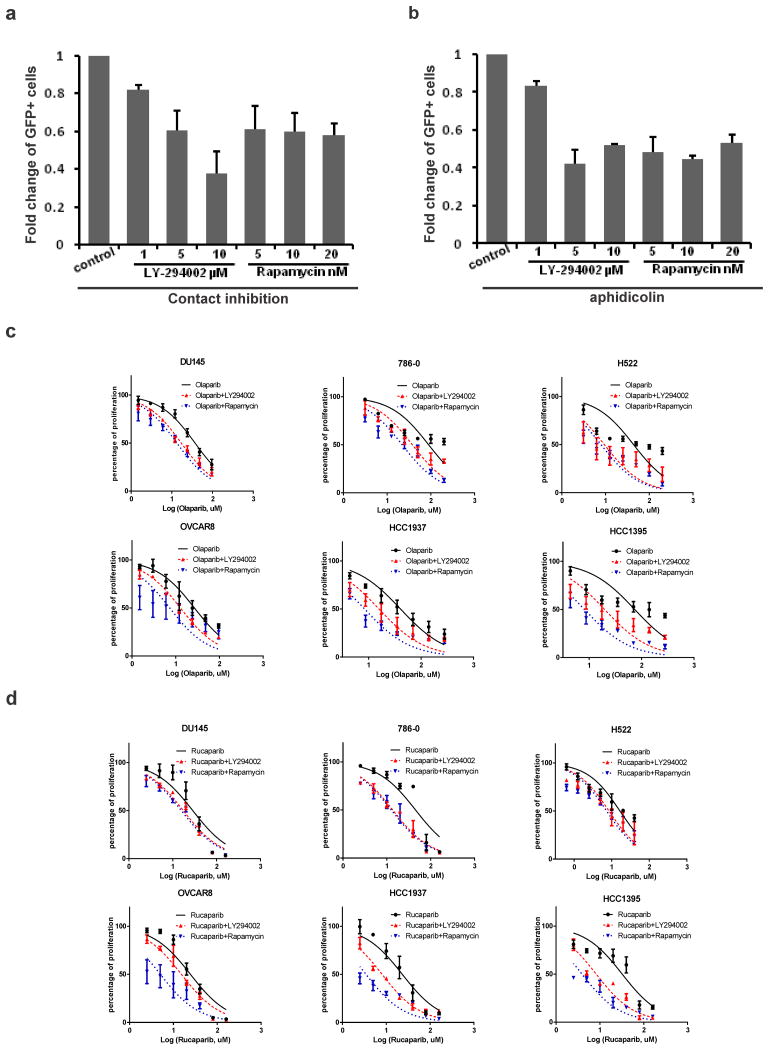
Figure 4. Validation of Agents Synergizing with PARP Inhibitors Treatment Predicted by the HRD Gene Signature.
(a) U2OS cells were seeded at a high density to allow contact inhibition and transfected with I-SceI plasmid to induce DSBs. Then cells were treated with the indicated concentrations of PI3K inhibitor LY-294002 or mTOR inhibitor rapamycin for 16 hr before analysis of GFP-positive cells.
(b) U2OS cells were treated with the indicated concentrations of LY-294002 or rapamycin after I-SceI transfection and then treated with replication inhibitor aphidicoline (10 μM) to synchronize cell cycle for 16 hr before the HR repair efficiency analysis. For both a and b, results are shown as mean + SD from three independent experiments. Student’s t-test (P<0.05).
(c, d) The indicated cancer cell lines were treated with single or combined treatment of PARP inhibitor olaparib (c) or rucaparib (d), with LY-294002 or rapamycin and analyzed by MTT assay. Each value is relative to the value in the cells treated with vehicle control. Results are shown as mean ± SEM from three independent experiments. The CI values calculated by CompuSyn software are listed in Supplementary Fig. 11c,d.

