Figure 2.

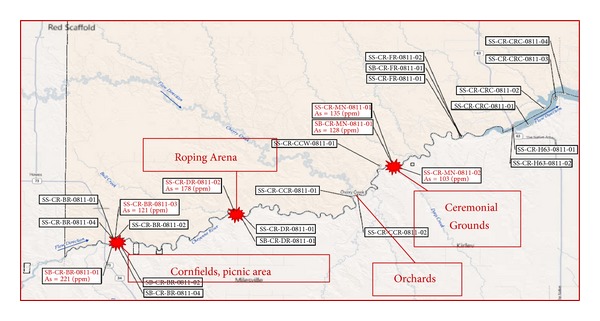
Map of arsenic sampling conducted by USEPA and CRST DENR. Concentrations of arsenic in sediment exceeding 100 ppm are marked with a burst pattern. Exposure-relevant sites are labeled with activities frequently conducted in those areas.

Map of arsenic sampling conducted by USEPA and CRST DENR. Concentrations of arsenic in sediment exceeding 100 ppm are marked with a burst pattern. Exposure-relevant sites are labeled with activities frequently conducted in those areas.