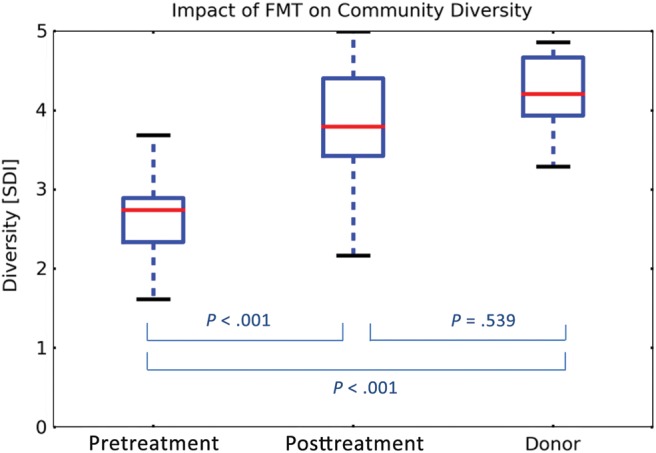
Figure 4.

Microbiota diversity in fecal samples obtained from fecal microbiota transplant recipients before and after the procedure, as compared with the donors, expressed by the Shannon diversity index. The box-and-whisker plots indicate interquartile ranges (boxes), medians (red horizontal lines), and range (whiskers). Abbreviations: FMT, fecal microbiota transplant; SDI, Shannon diversity index.
