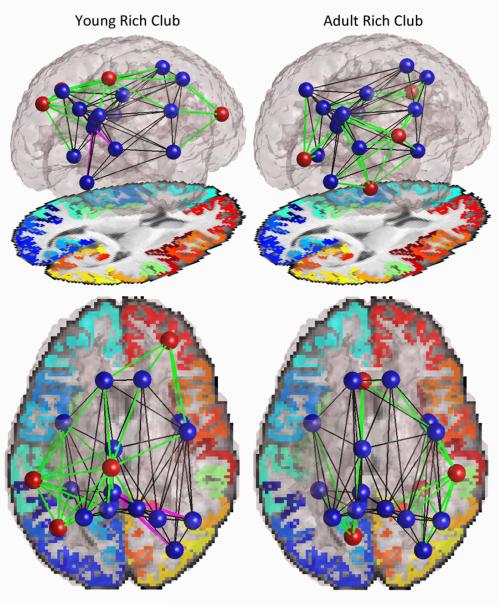
Figure 3.
Rich club networks in young (12 and 16 year old) and adult (20-30 year old) cohorts. Blue nodes were present in the rich clubs of both groups; red nodes were unique to one of the groups. Black edges were present in both groups, green edges were unique to one of the groups as they involved unique nodes, magenta edges were unique to one of the groups among nodes common to both groups. Edges are thresholded to only show those present in >75% of subjects in either group.

