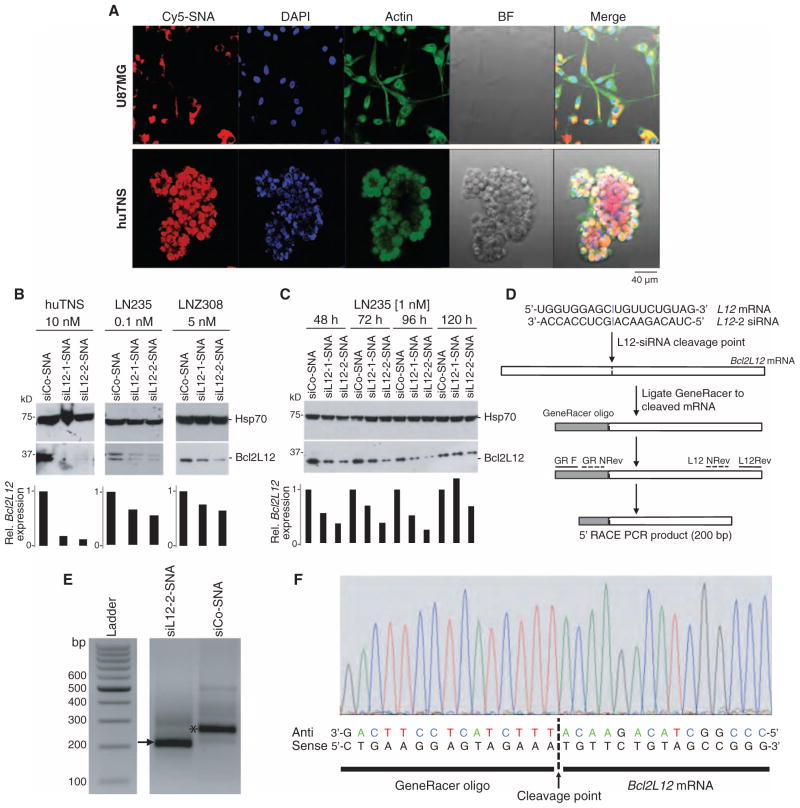
Fig. 1. SNAs penetrate glial cells and down-regulate Bcl2L12 in vitro.
(A) Uptake of Cy5-labeled SNAs (red) into huTNS and the human glioma cell line U87MG. Cells were colabeled with fluorescein isothiocyanate (FITC)–conjugated cytochalasin (green) and 4′,6-diamidino-2-phenylindole (DAPI) (blue) to visualize actin filaments and nuclei, respectively. Scale bars, 40 μm. BF, bright field. (B) Effect of Bcl2L12-targeting SNAs siL12-1 and siL12-2 on Bcl2L12 protein levels in huTNS, LN235, and LNZ308 glioma cells relative to control (siCo-SNA) cultures as assessed by Western blot using the noted concentrations of SNAs. Hsp70 served as a loading control. Bar graphs represent a densitometric analysis of Western blots. Band intensity was normalized to Hsp70 and then expressed relative to Bcl2L12 levels in siCo-treated samples. (C) Bcl2L12 knockdown persistance in LN235 cells treated with 1 nM siCo-SNA, siL12-1-SNA, or siL12-2-SNA for 48, 72, 96, and 120 hours as assessed by Western blot. (D) Schematic depicting siL12-2 siRNA cleavage site and subsequent 5′-RLM-RACE PCR. (E) Resulting bands from successive rounds of PCR on the cDNA template using GeneRacer- and Bcl2L12-specific primers in siL12-2-SNA–and siCo-SNA–treated cells. The arrow points to the cleavage product. The asterisk represents a PCR product that is a fragment of Bcl2L12, not ligated to the GeneRacer oligo, and is thus a nonspecific band. (F) DNA sequence chromatogram of resulting PCR product from siL12-2-SNA–treated cells.

