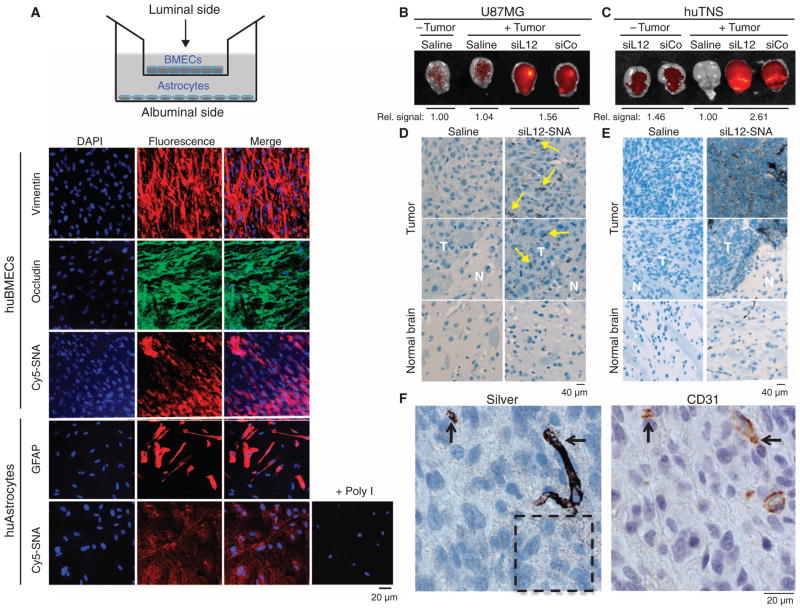
Fig. 4. SNAs cross the BBB/BTB and selectively accumulate in glioma tissue.
(A) Noncontact in vitro BBB model using a coculture of huBMECs and human astrocytes. Representative confocal fluorescence microscopy images demonstrate Cy5.5-SNA (red) distribution in endothelial and astrocytic cells. Endothelial and astrocytic cells stained positively for occludin (a marker for tight junctions) and glial fibrillary acidic protein (GFAP), respectively. Anti-vimentin and DAPI stained cytoplasm and nuclei, respectively. (B and C) IVIS analysis of brains with or without U87MG (B) or huTNS (C) tumors 48 hours after systemic delivery of saline or Cy5.5-SNAs. SNA accumulation is indicated by increased fluorescence (yellow). Quantification of radiant efficiency is shown as relative signal amount under the images. (D and E) Selective accumulation of Cy5.5-SNAs within U87MG (D) or huTNS (E) tumors, but not normal brain elements. Coronal brain sections were silver-stained and counterstained with hematoxylin. Yellow arrows indicate sites of SNA accumulation, which appear as dark brown regions. T, tumor; N, normal brain. (F) huTNS-derived accumulated SNAs in vascular and extravascular tumor elements as revealed by silver staining and anti-CD31 immunohistochemistry on adjacent coronal sections. Arrows point to areas of SNA and CD31 colocalization. Hashed box shows SNAs that extravasated into the tumor parenchyma.

