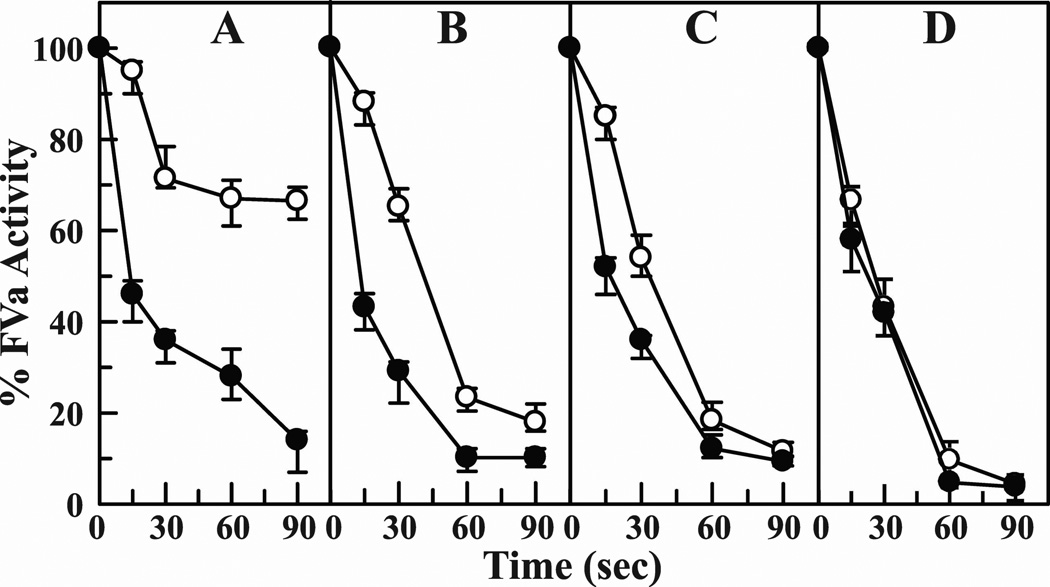
Figure 9. Effect of Mg2+ on the kinetics of inactivation of FVa by APC.
Percent FVa residual activity is plotted against time. Inactivation was monitored by the decrease in FVa clotting activity as described in ″Materials and Methods″. APC was 8 nM, FVa was 120 nM and phospholipid was 10 µM. The reaction was carried out at 37 °C in buffer containing various concentrations Ca2+ (panel A, 0.5 mM Ca2+; panel B, 0.8 mM Ca2+; panel C, 1.1 mM Ca2+; and panel D, 2 mM Ca2+) in the absence (○) or presence of 0.6 mM Mg2+ (●). The results presented are the average of three experiments.

