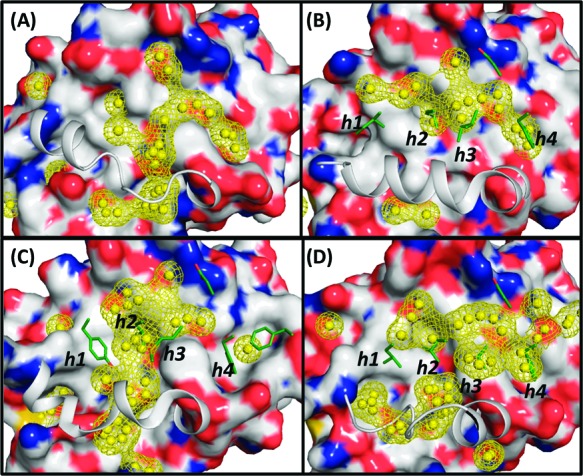
Figure 3.

Hydrophobic hot spots (yellow balls) in the BH3 peptide binding groove detected from the cosolvent mapping method based on 32 ns of simulations. (A−D) Results using the apo-, Bim-bound, Bad-bound, and Bec1-bound Bcl-xL conformations, respectively. Four conserved hydrophobic residues and one acidic residue are shown in the stick model. Crystal structures of each conformation are used as the reference. The α3 helix is shown without the surface rendering for clarity.
