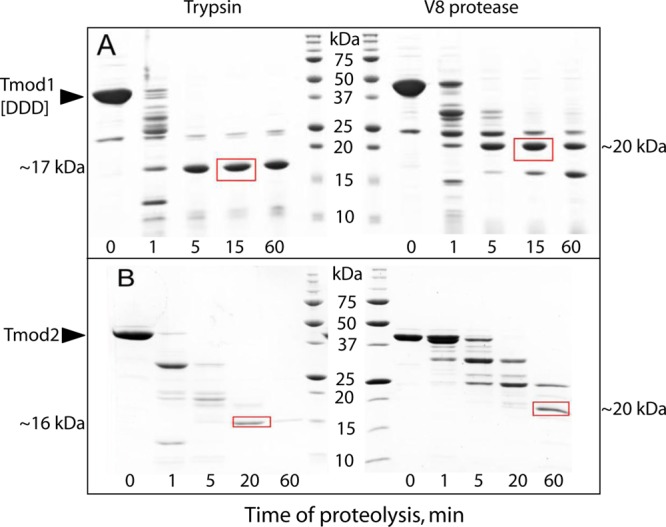
Figure 4.

Time course proteolysis of (A) Tmod1[DDD] and (B) Tmod2. Trypsin and S. aureus V8 protease were added to Tmods [1:200 and 1:50 (w/w) ratios, respectively]. The arrowheads indicate the positions of Tmods. The molecular masses shown on the sides of the images correspond to boxed bands that were used for N-terminal sequencing. Molecular mass standards are 250, 150, 100, 75, 50, 37, 25, 20, 15, and 10 kDa.
